Transform Complex Google Analytics data into Simple, Visual Reports with Looker Studio

On this Page
- Getting Started
- Visualize Key Insights
- Source Traffic as a Pie Chart
- Events by Country Using Google Maps
- Sortable Table View
- Top Data with a Timeline
- Organize Your Report with Pages
- Add a Global Date Filter
- Capture Demographics Data
- Turn on Google Signals
- Capture On-Site Search Keywords
- Ready to Simplify Your Analytics?
Turn your Google Analytics 4 (GA4) data into clear, interactive, and automated reports your team can actually use.
Looker Studio (formerly Data Studio) connects directly to GA4, giving you full design control and custom visualizations — no code required.
Getting Started #
- Go to Looker Studio
- Click “Blank Report”
- Choose Google Analytics 4 as your data source.
- Select your property and data stream.
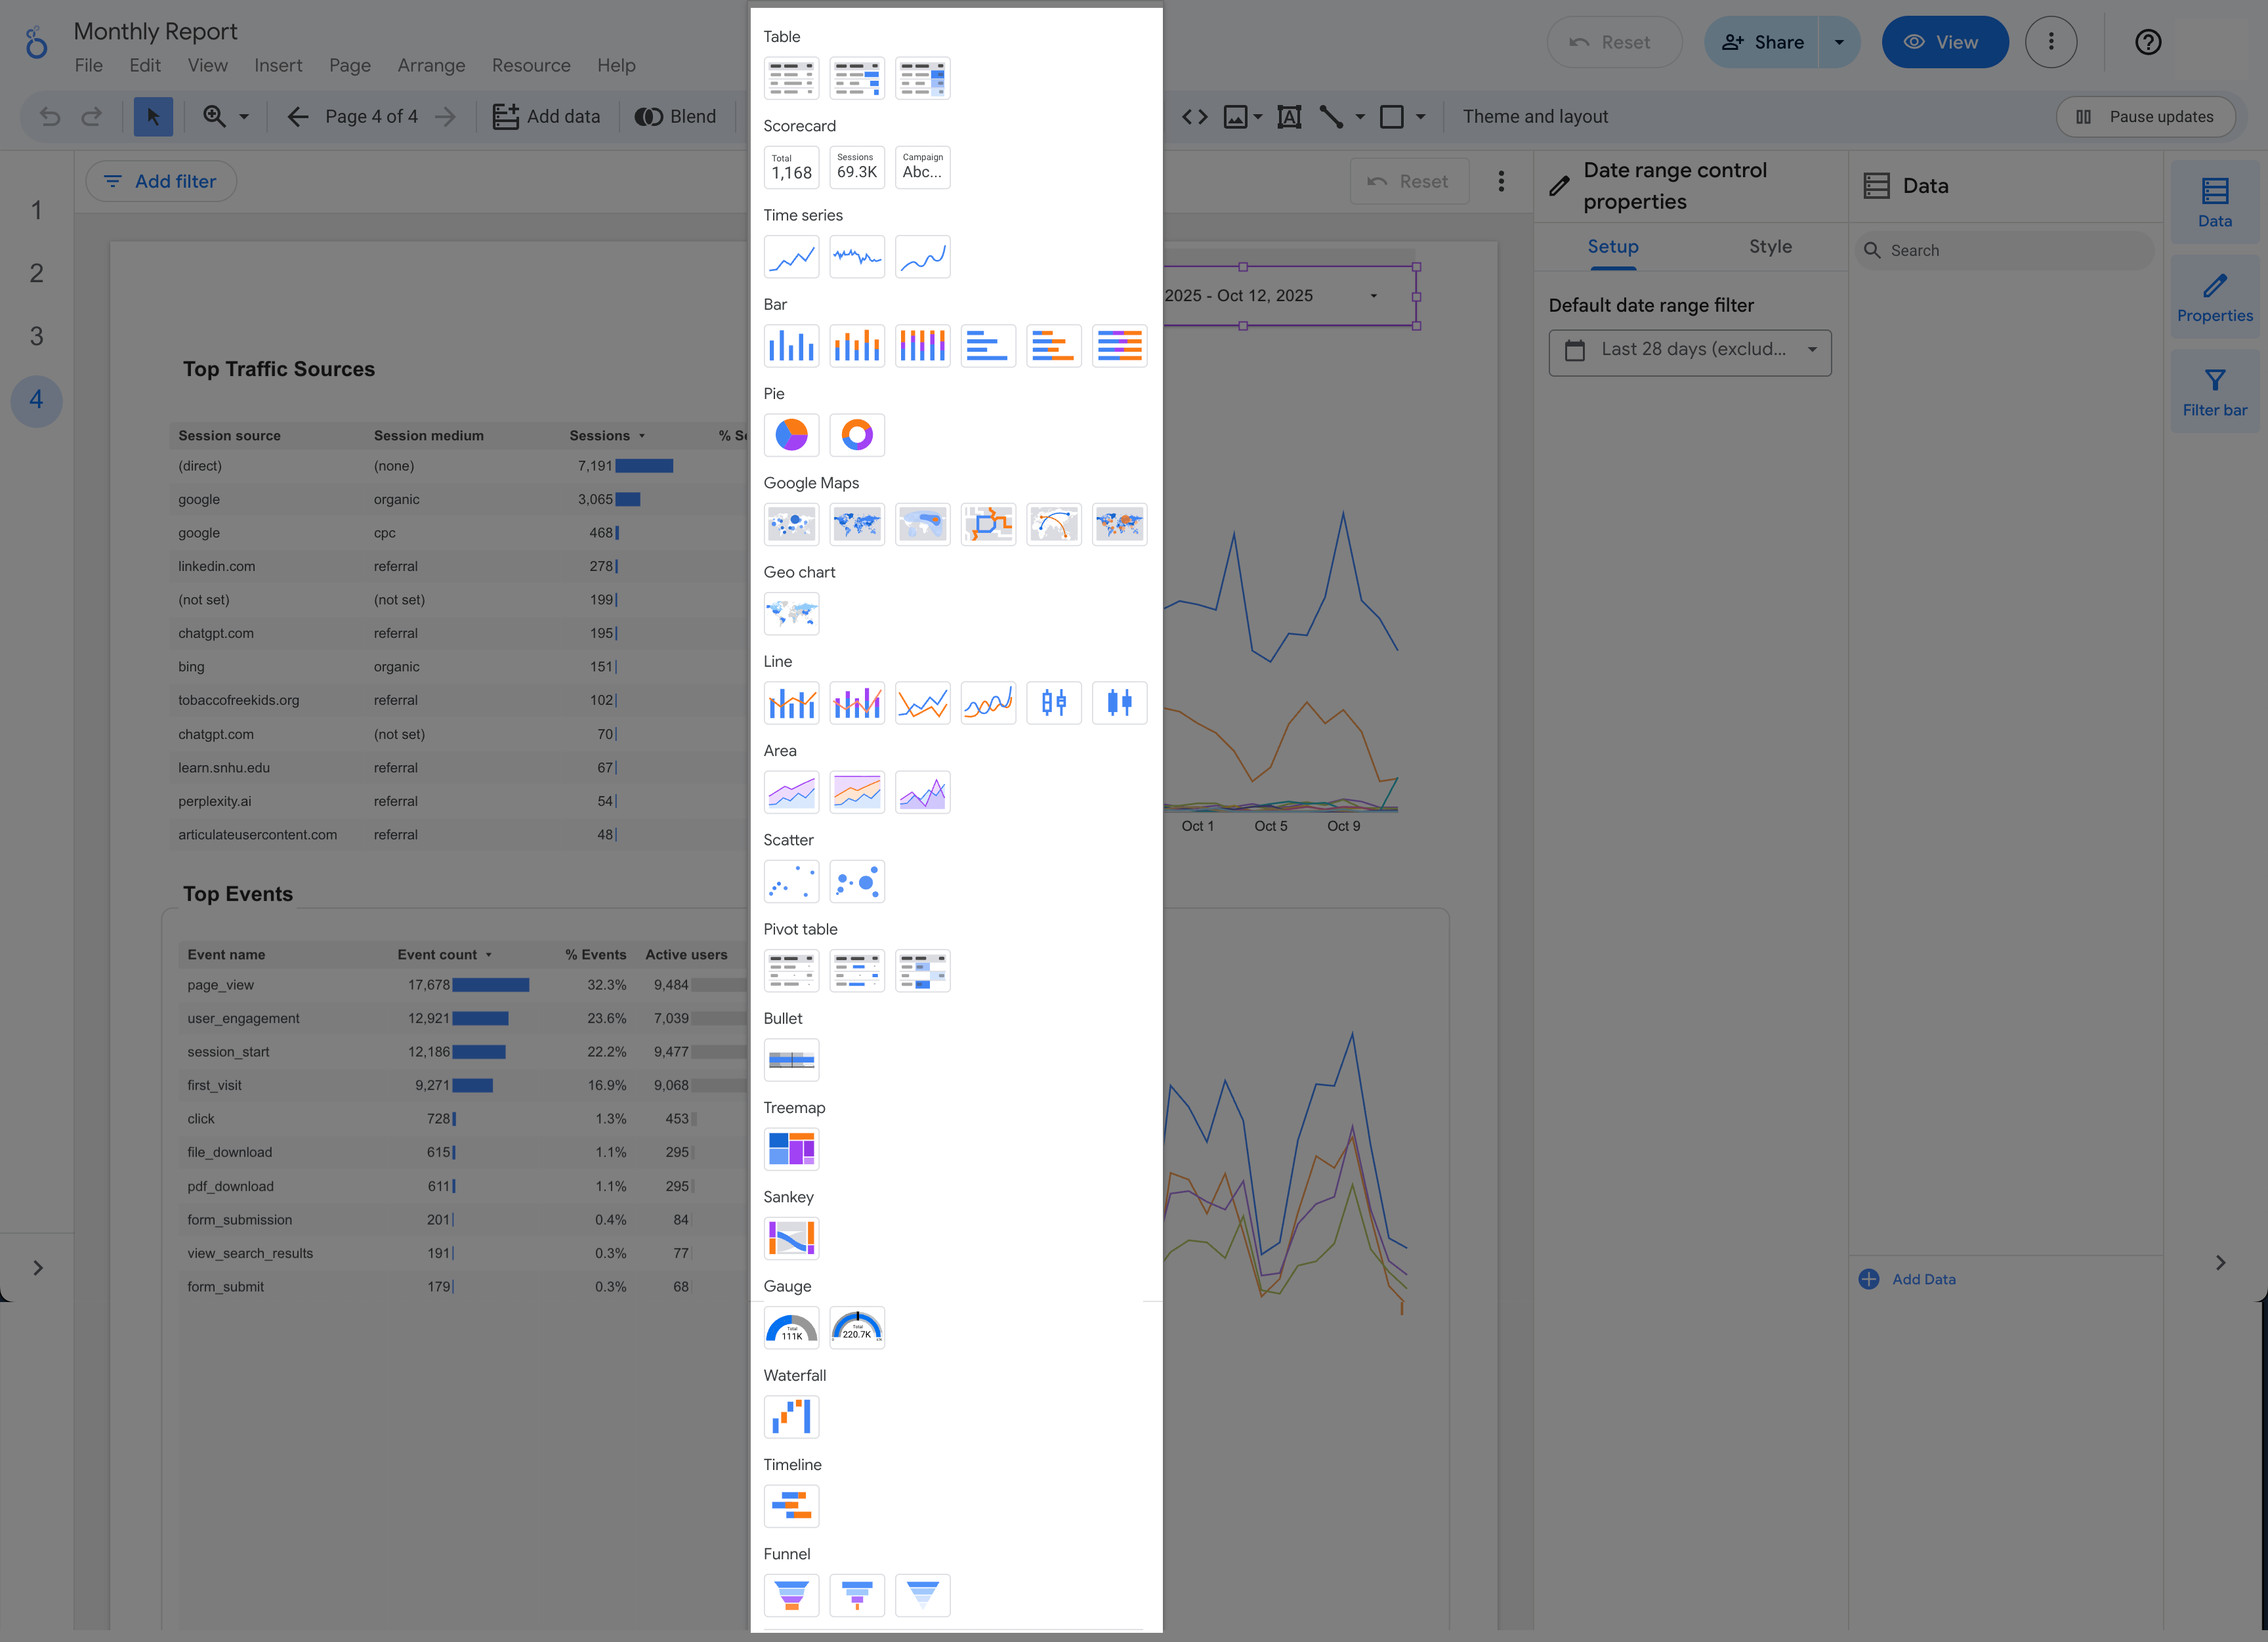
- Start customizing your report — choose the data and chart type from the menu:
Visualize Key Insights #
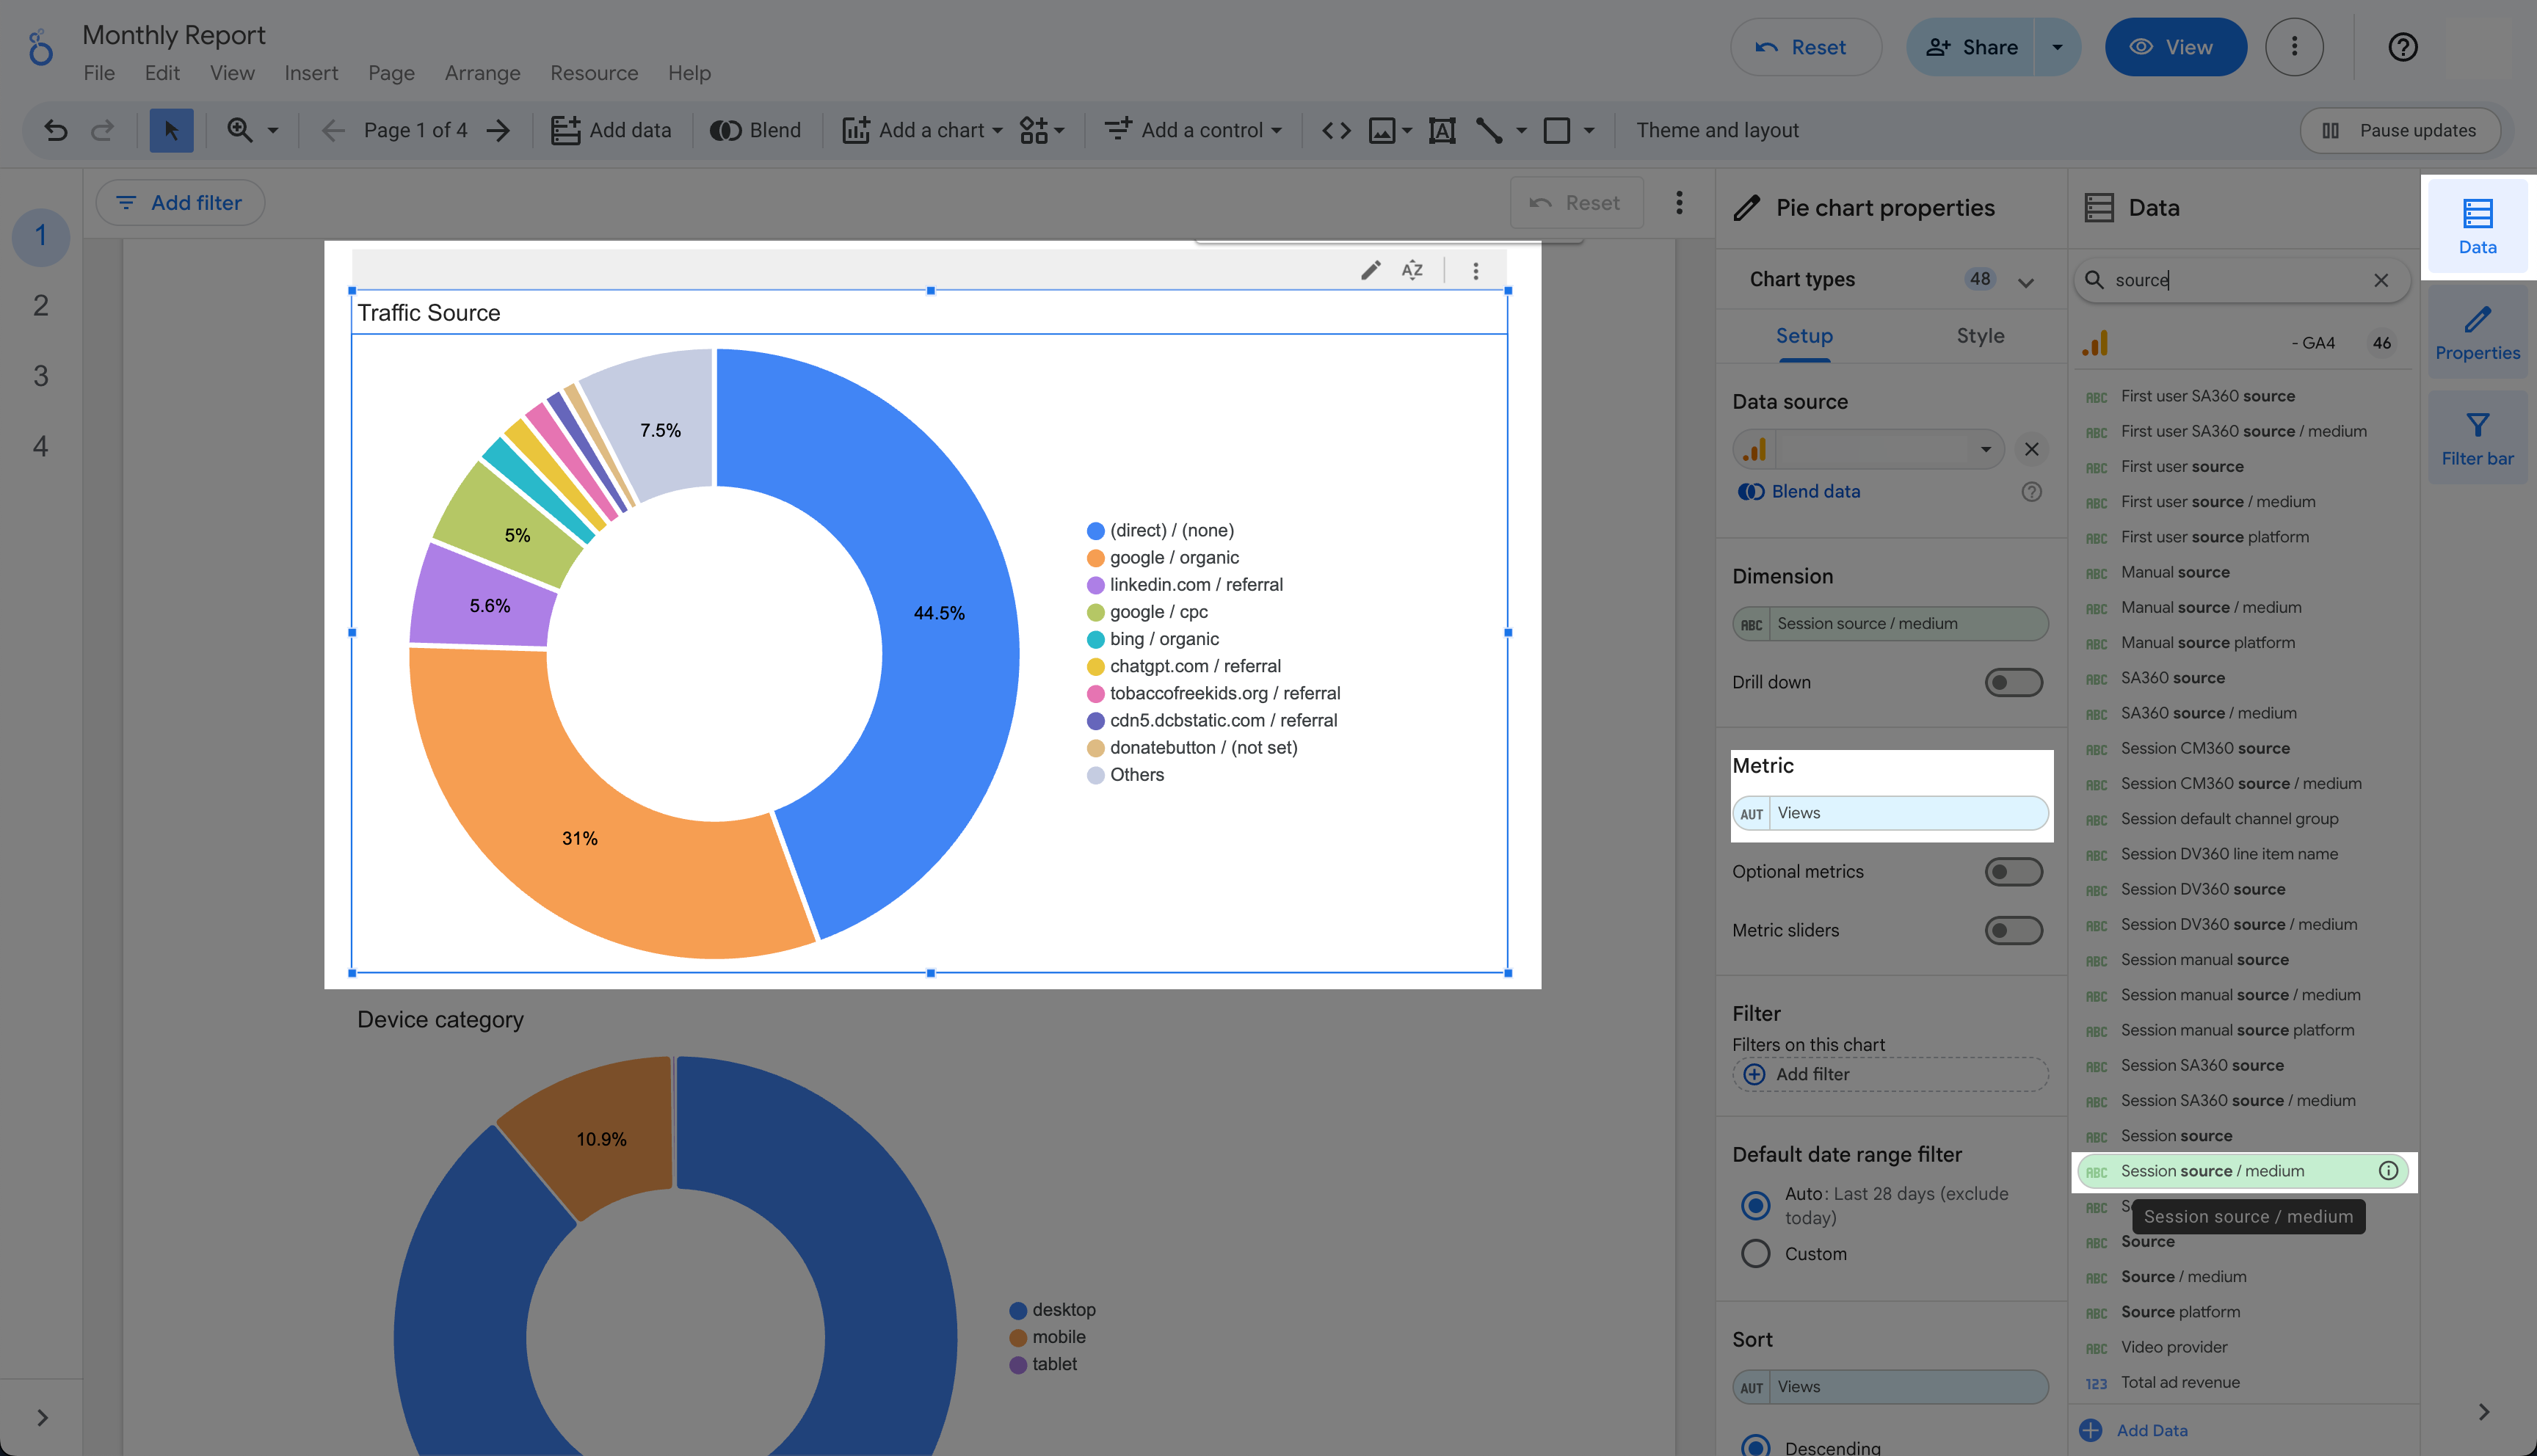
Source Traffic as a Pie Chart #
Quickly identify where your visitors are coming from.
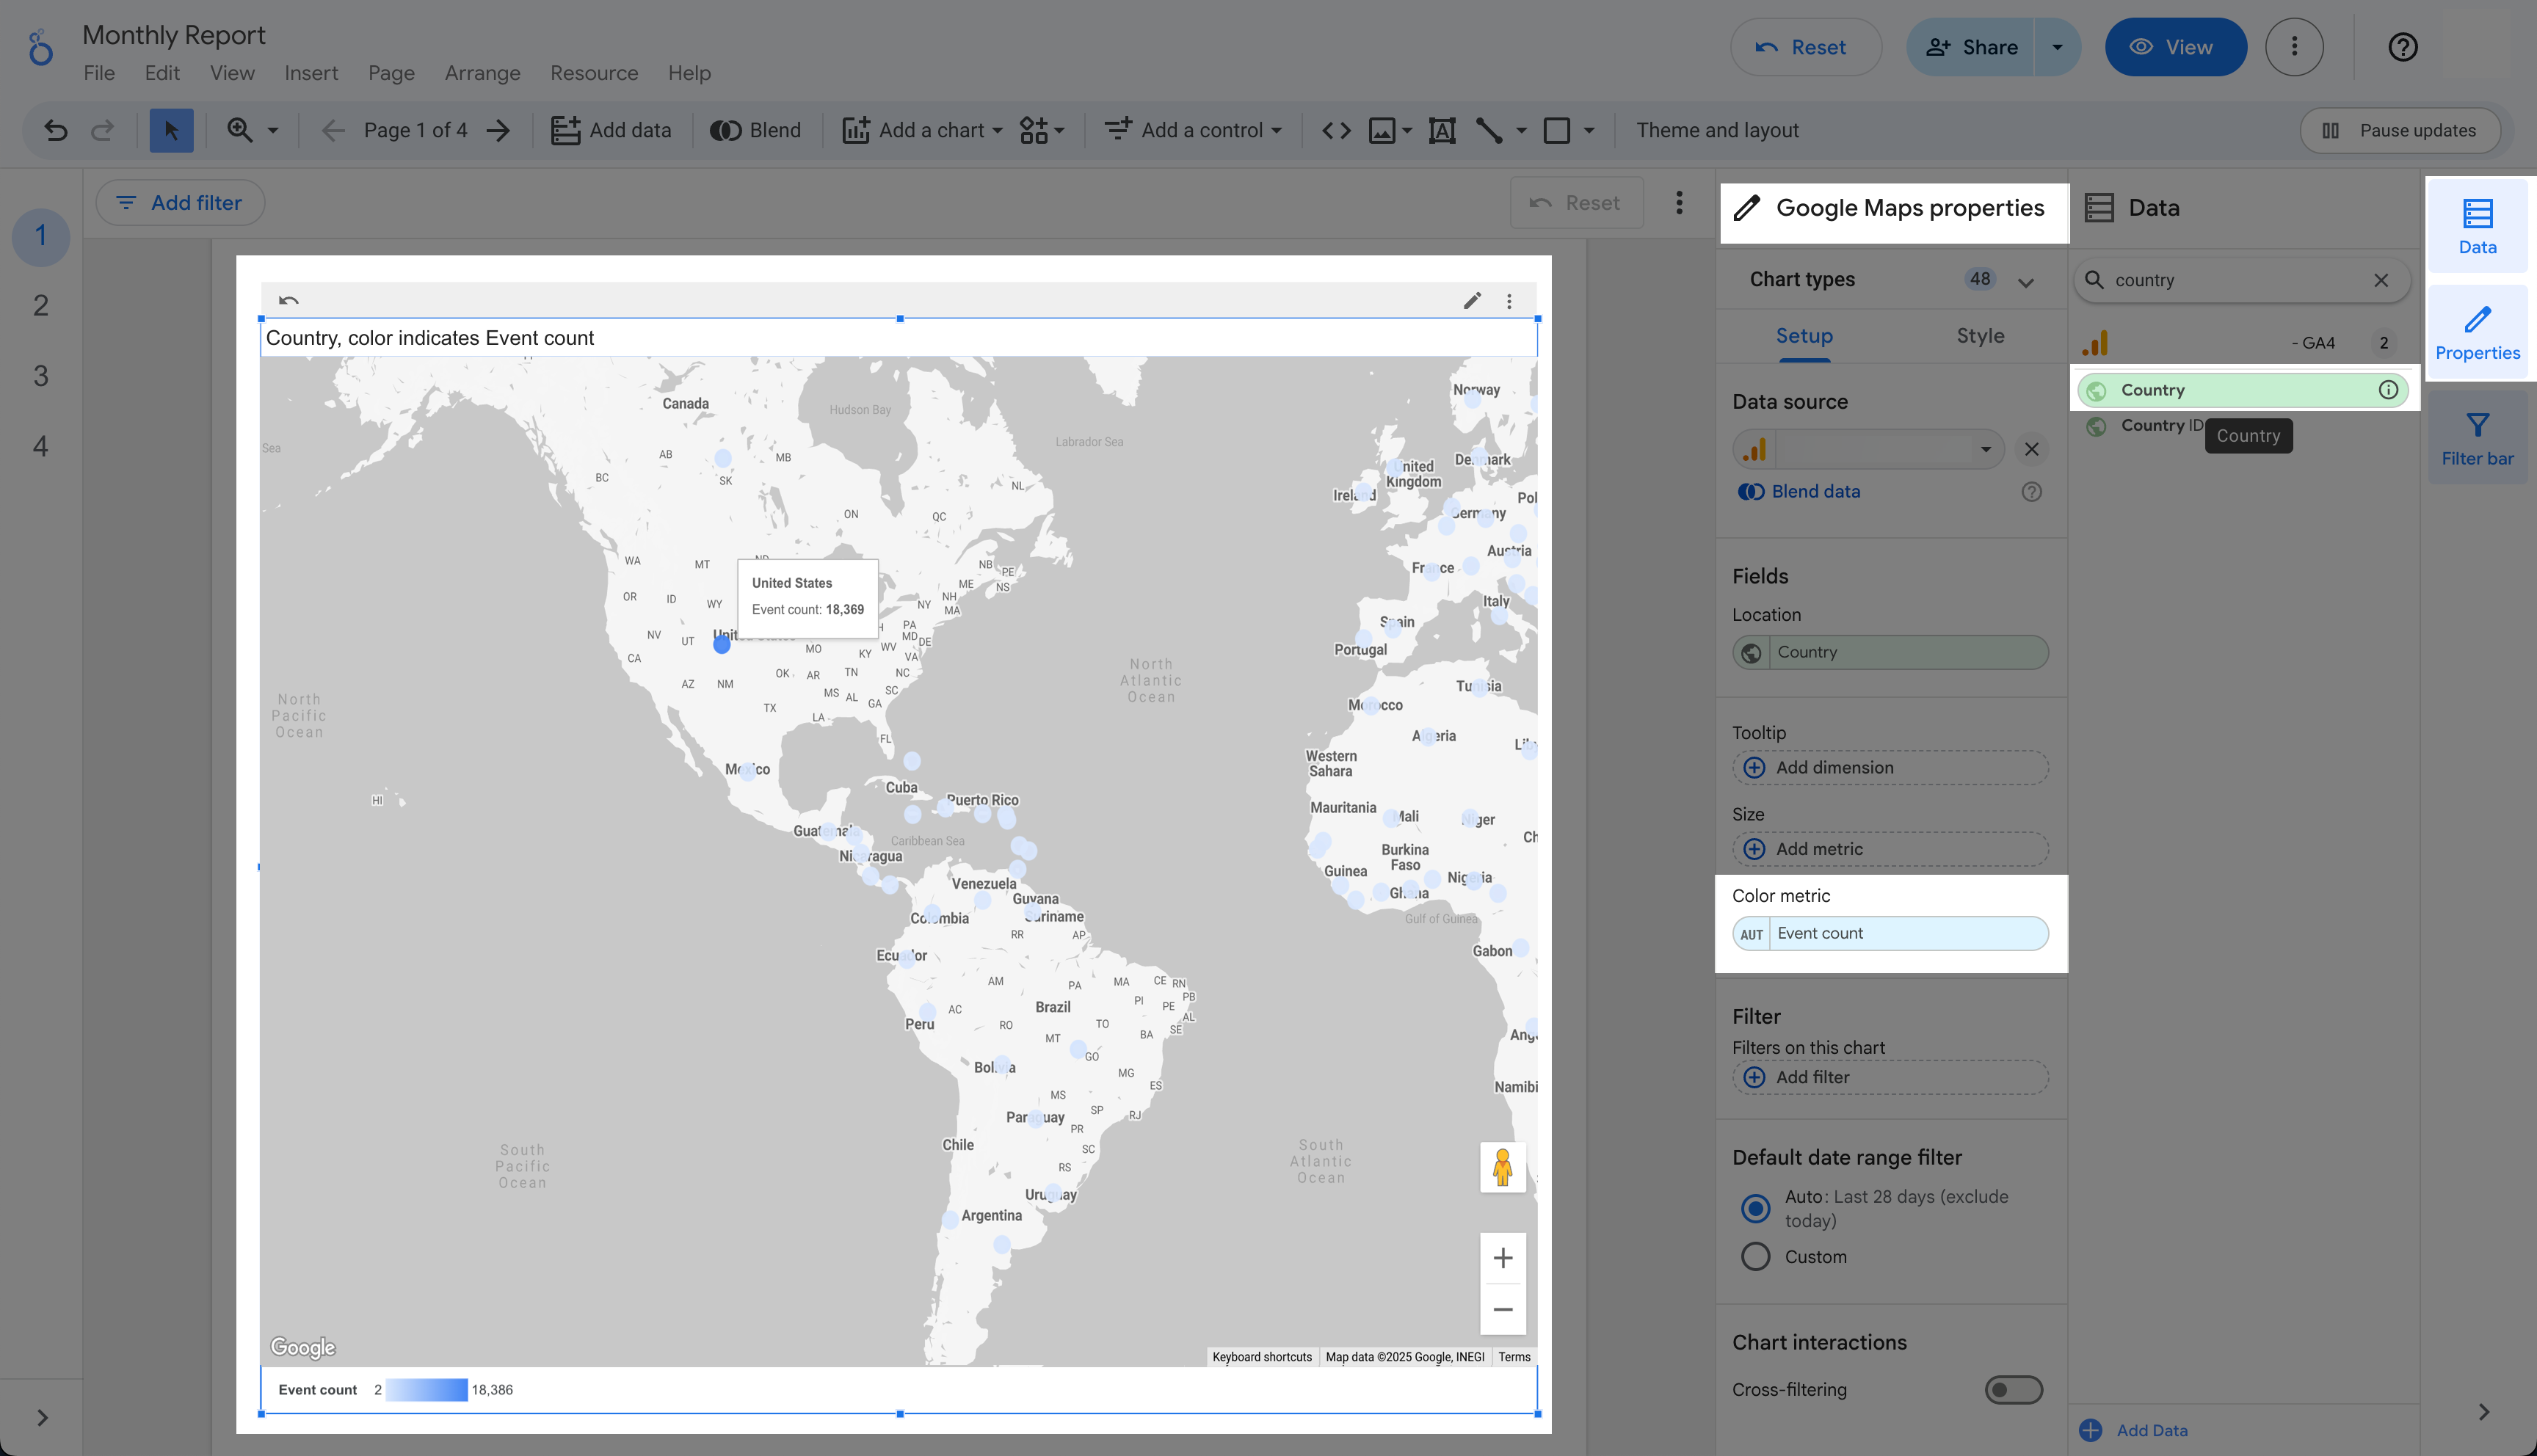
Events by Country Using Google Maps #
See engagement patterns worldwide.
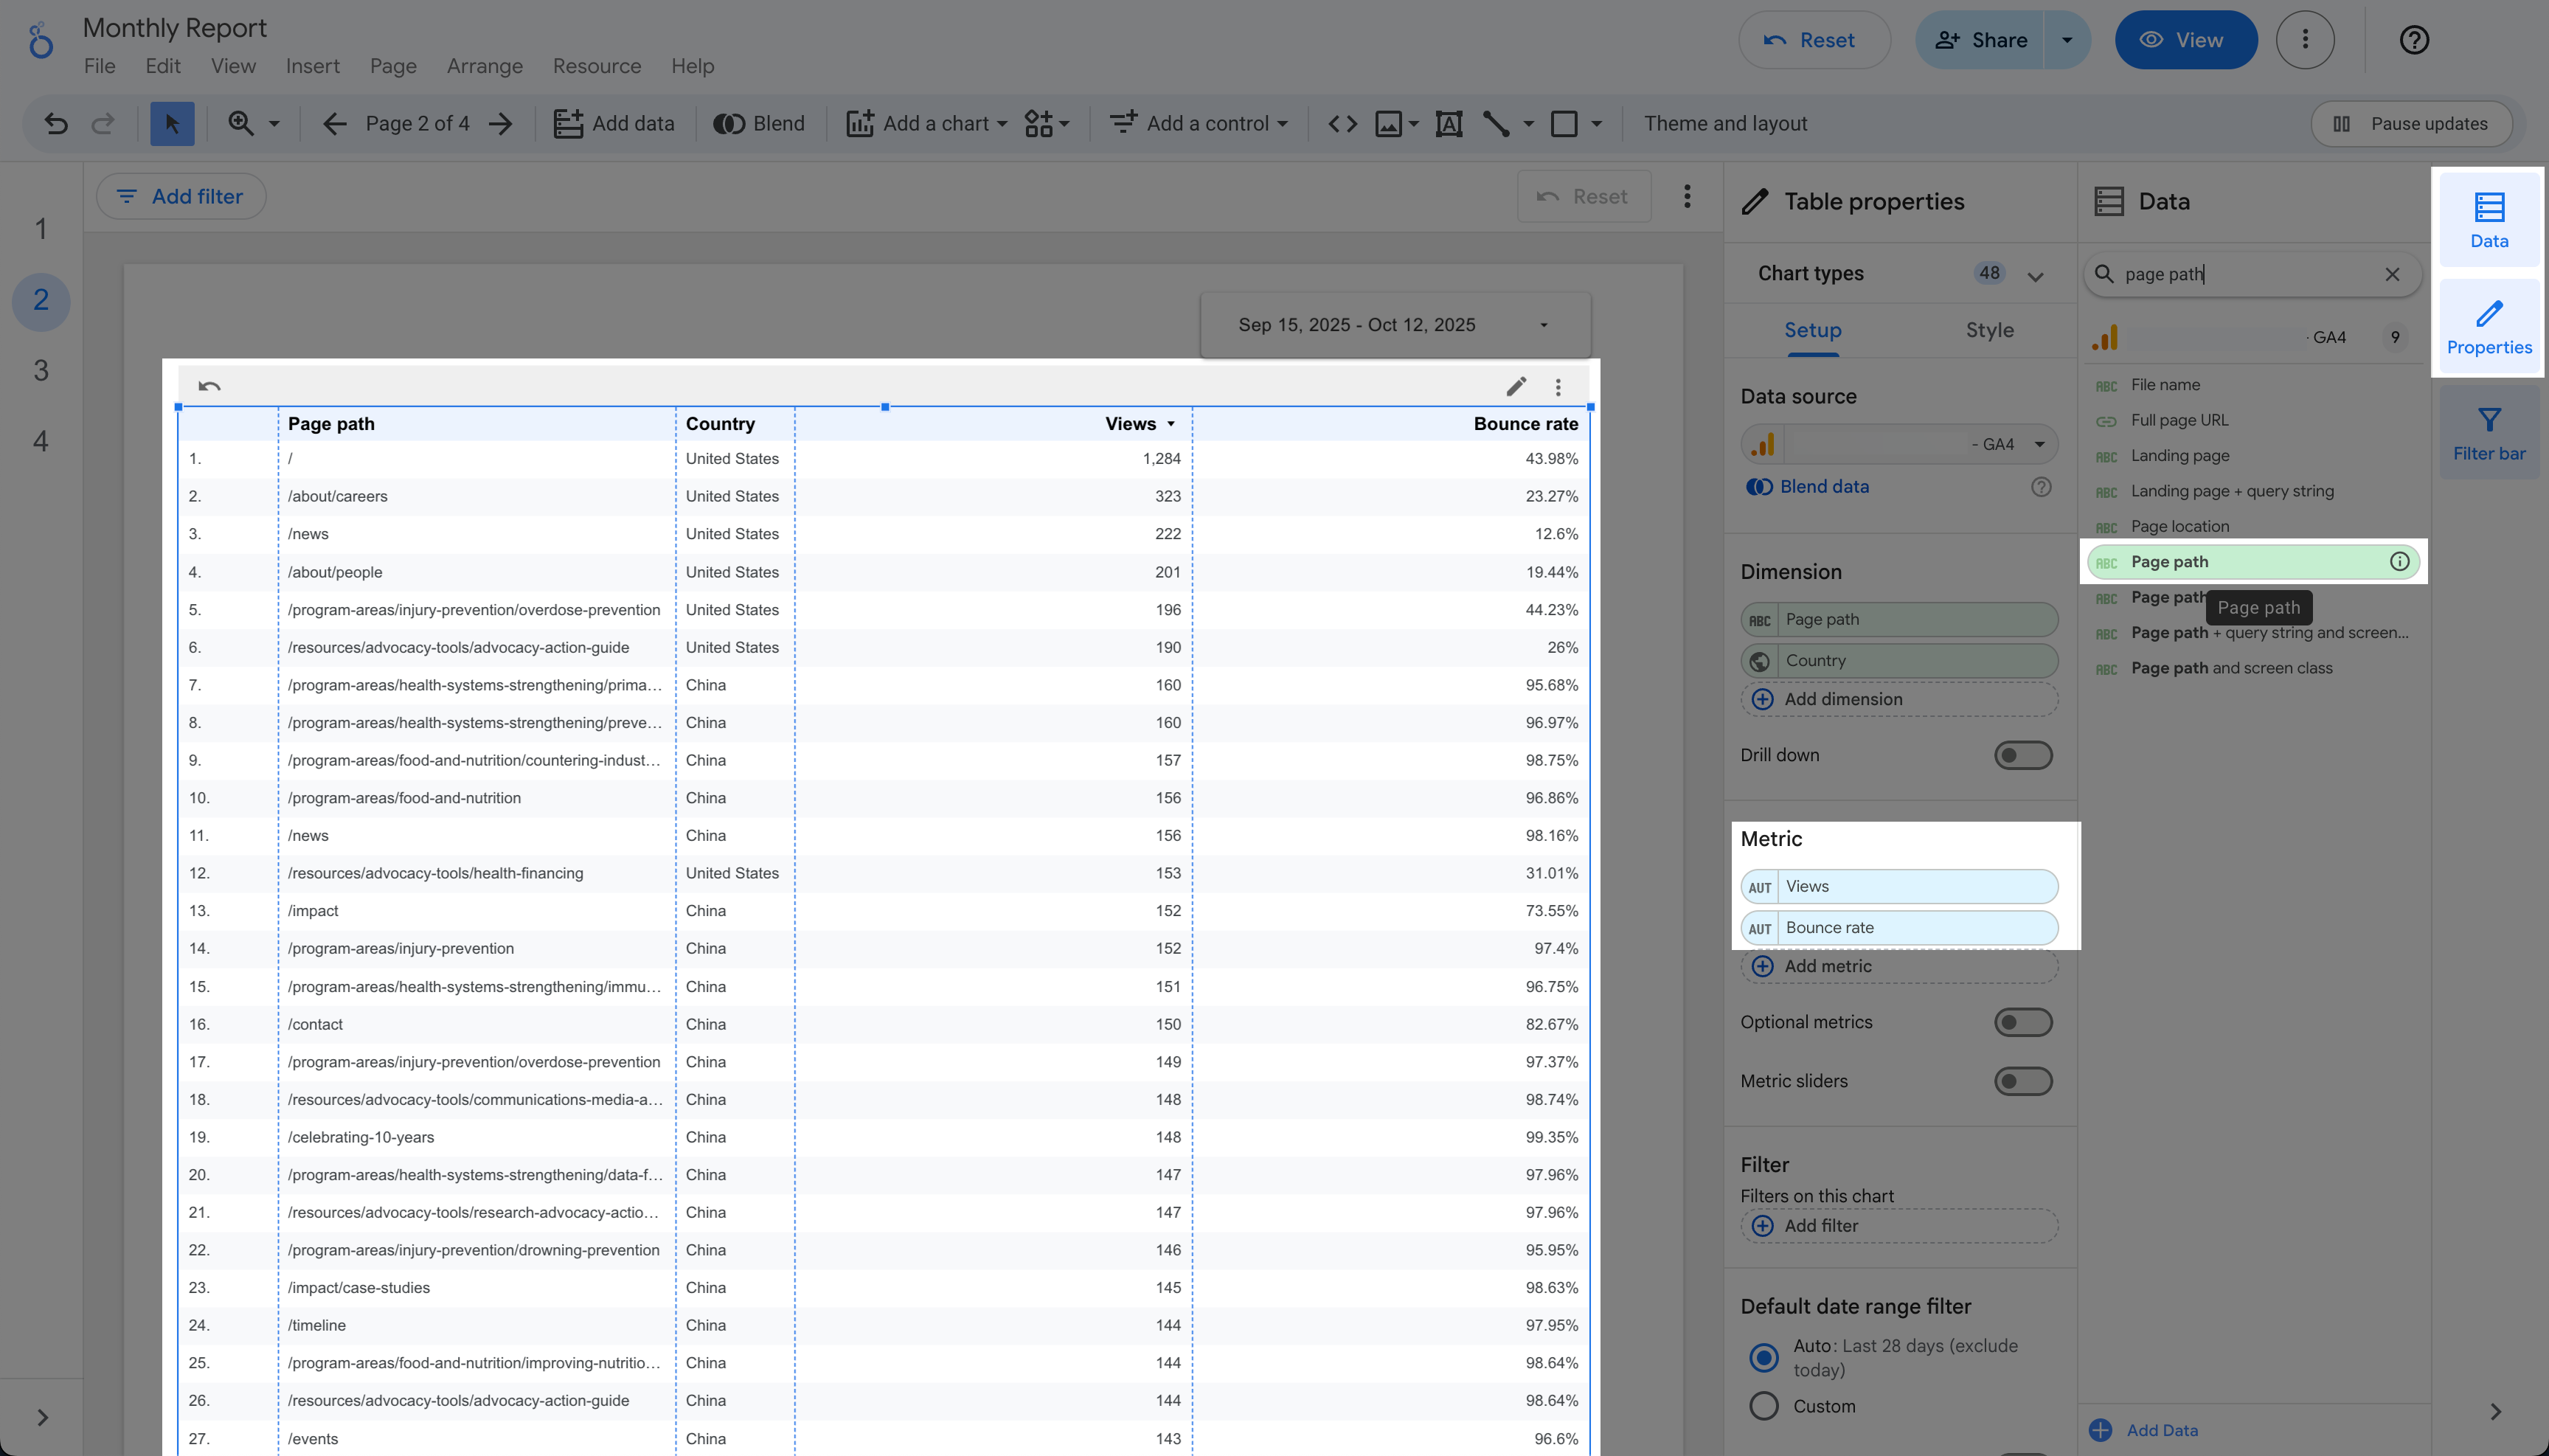
Sortable Table View #
Let users explore and sort metrics by column.
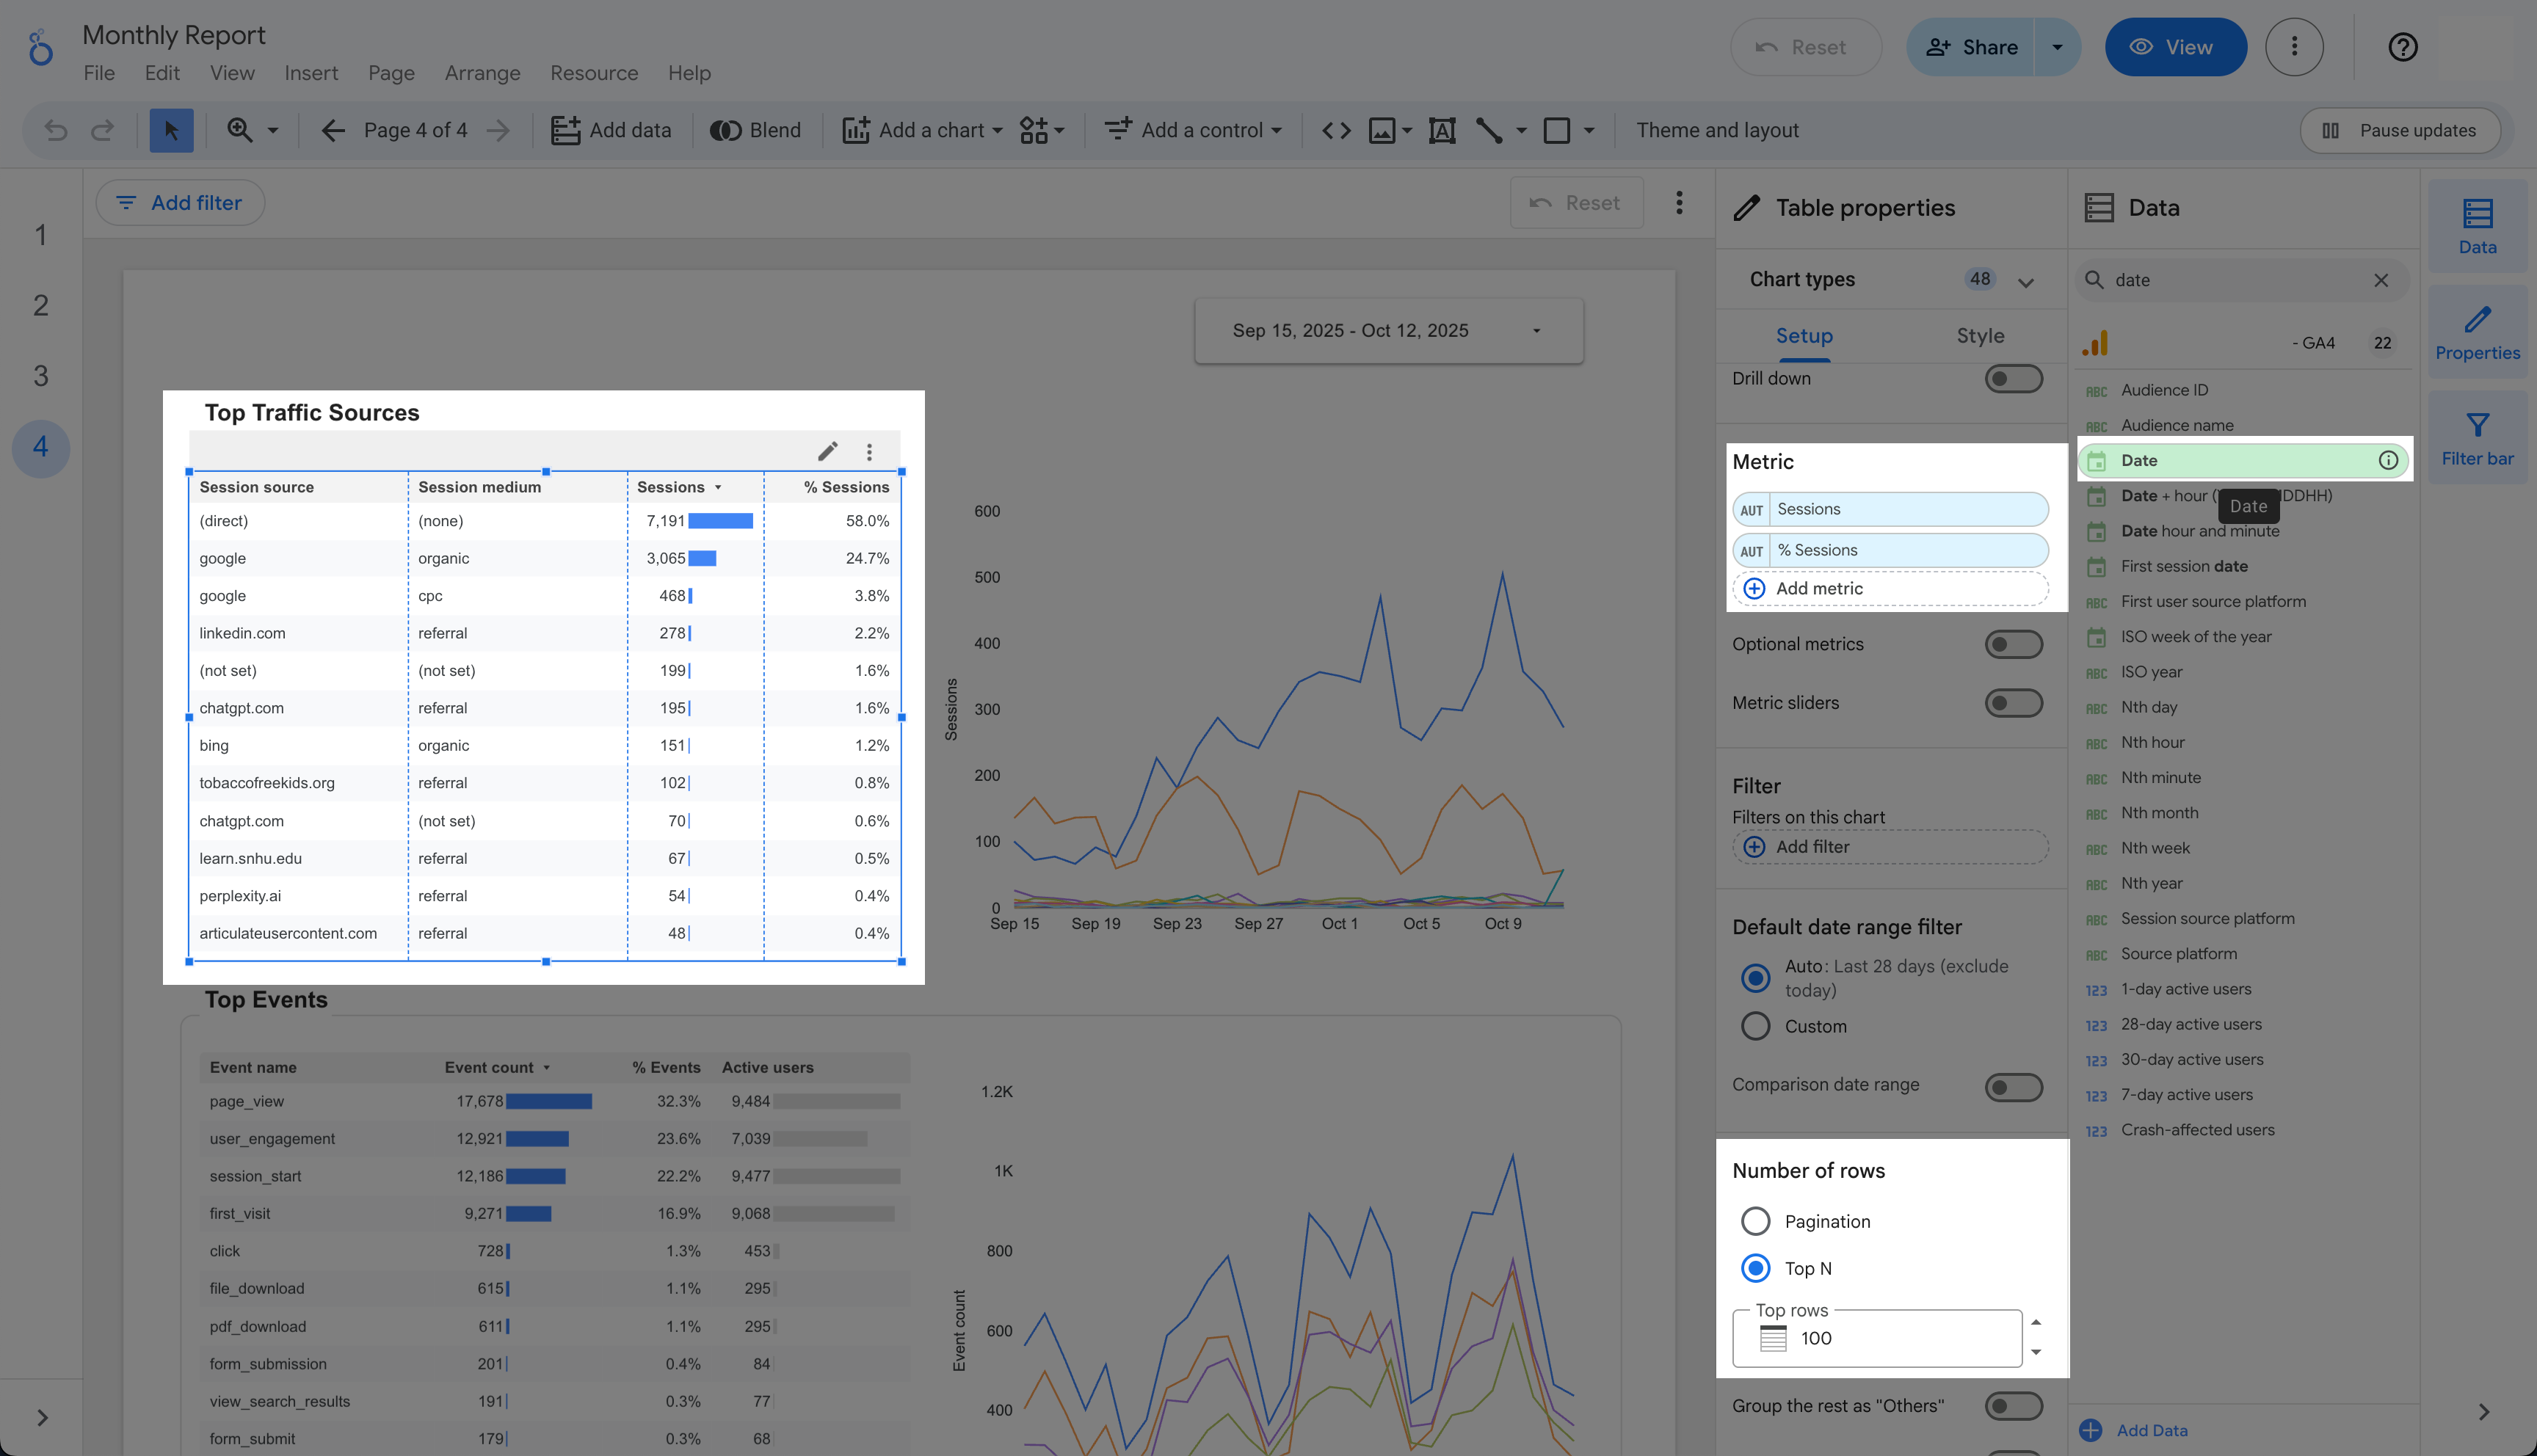
Top Data with a Timeline #
Limit to the top 10, 50, or 100 items — then attach a time-based chart for trends.
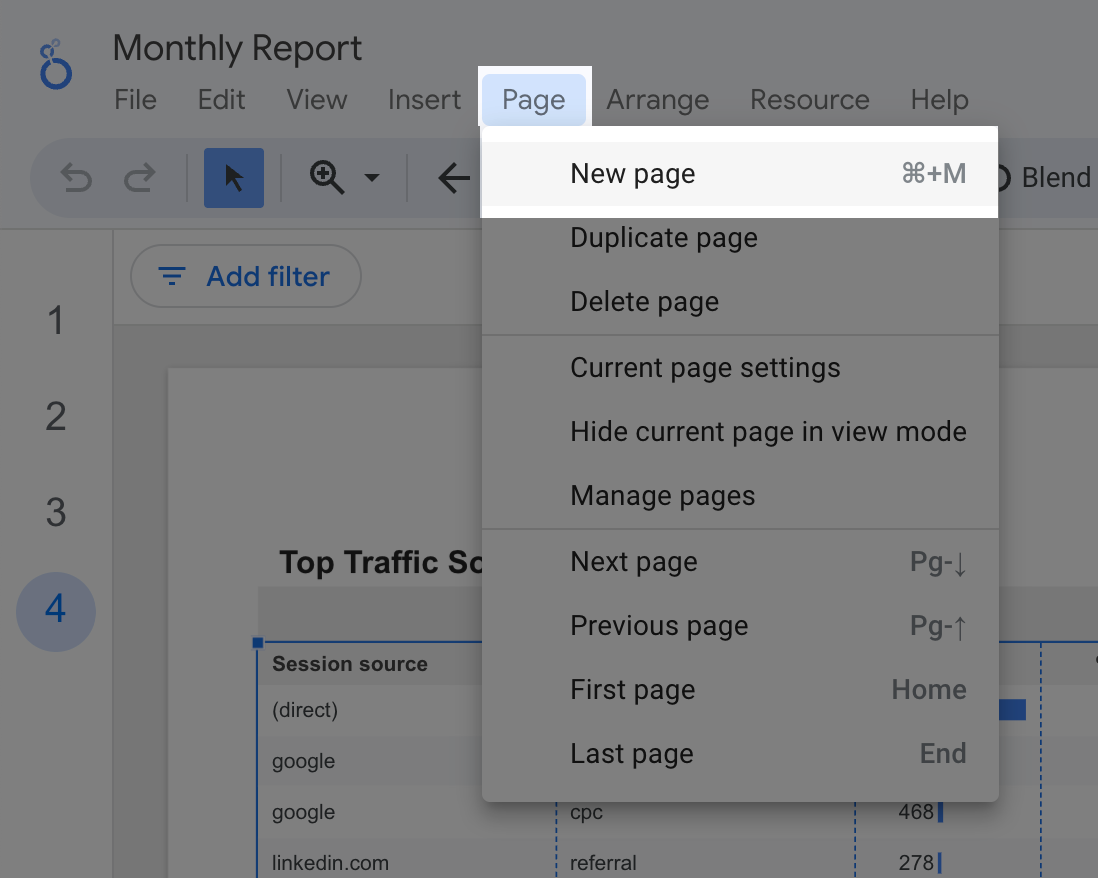
Organize Your Report with Pages #
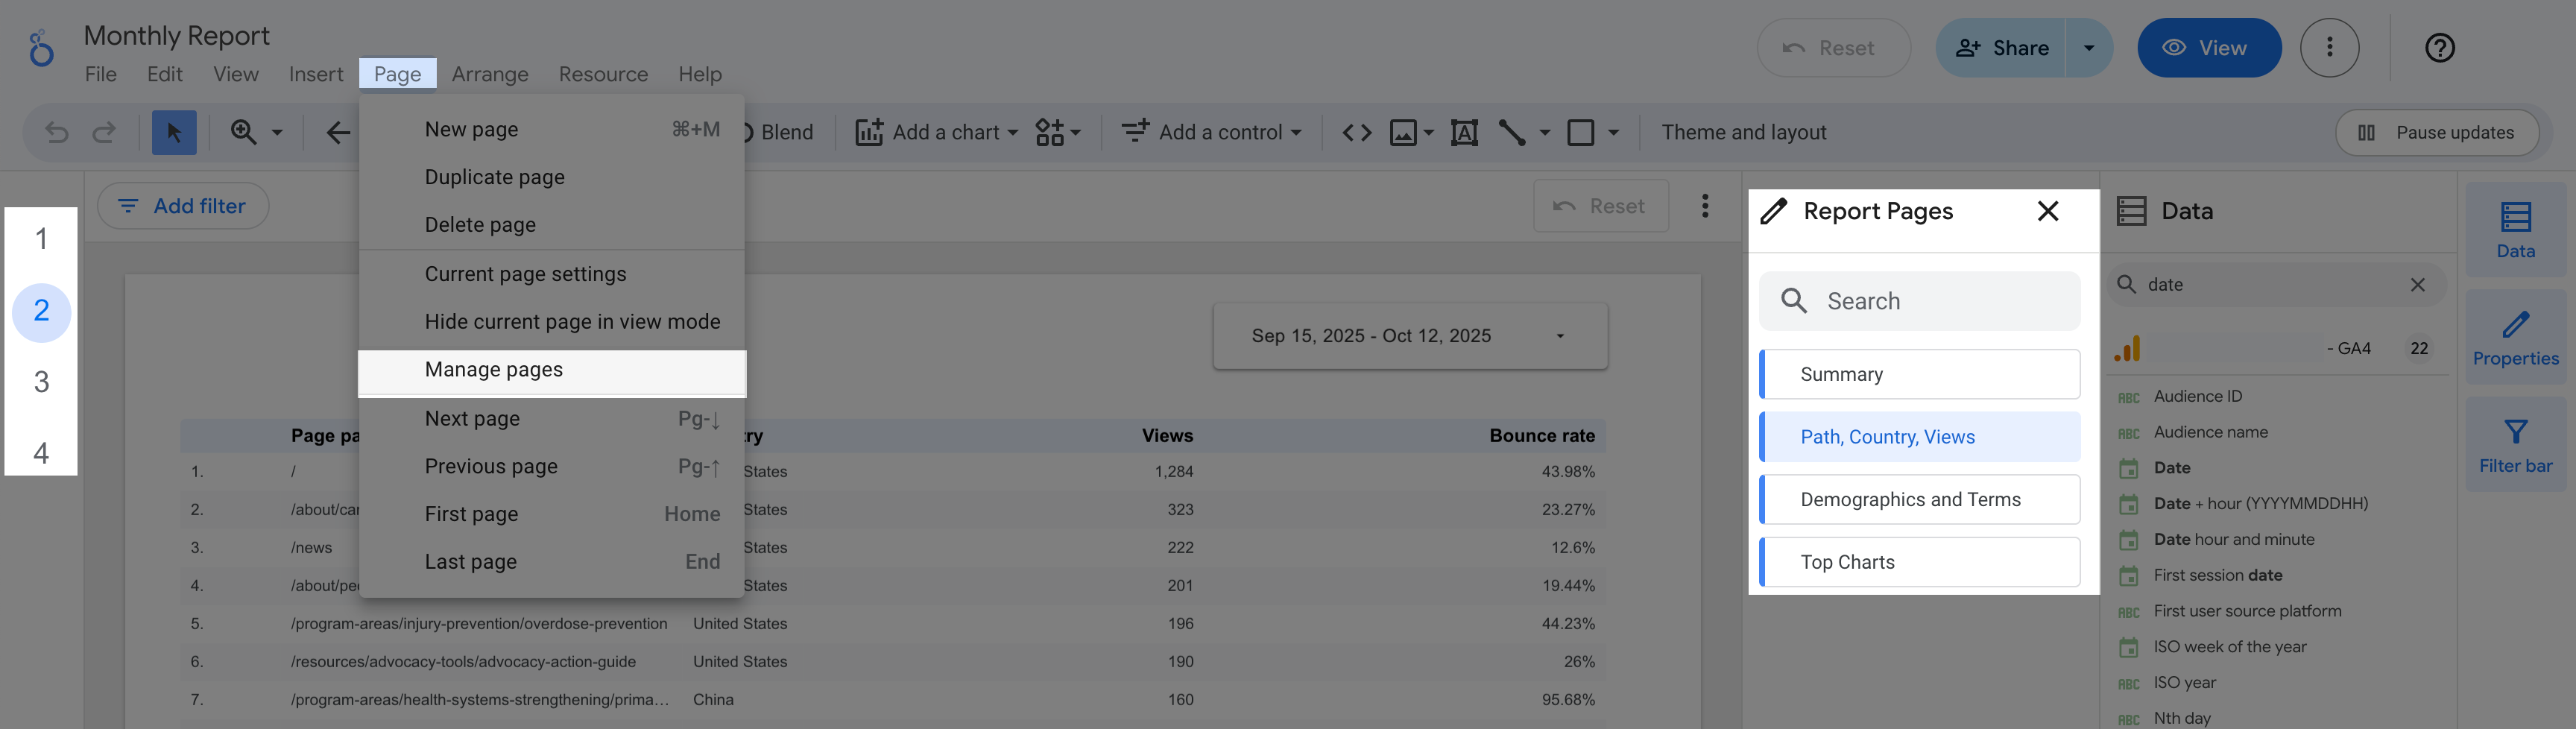
Break down your dashboard into clear sections for quick navigation.
Click Add a New Page
Rename the page title to display in the sidebar navigation
Add a Global Date Filter #
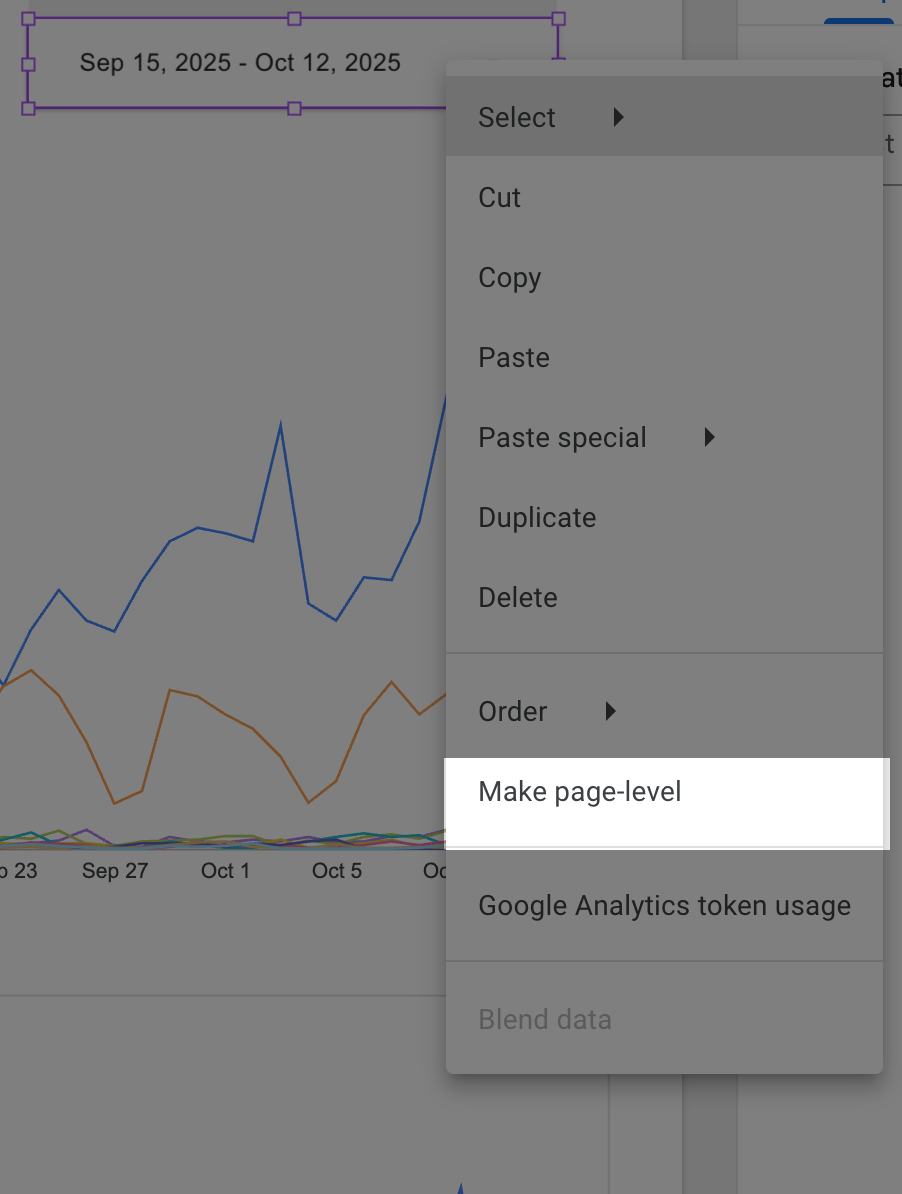
Add a Date Range selector at the top of your report to filter
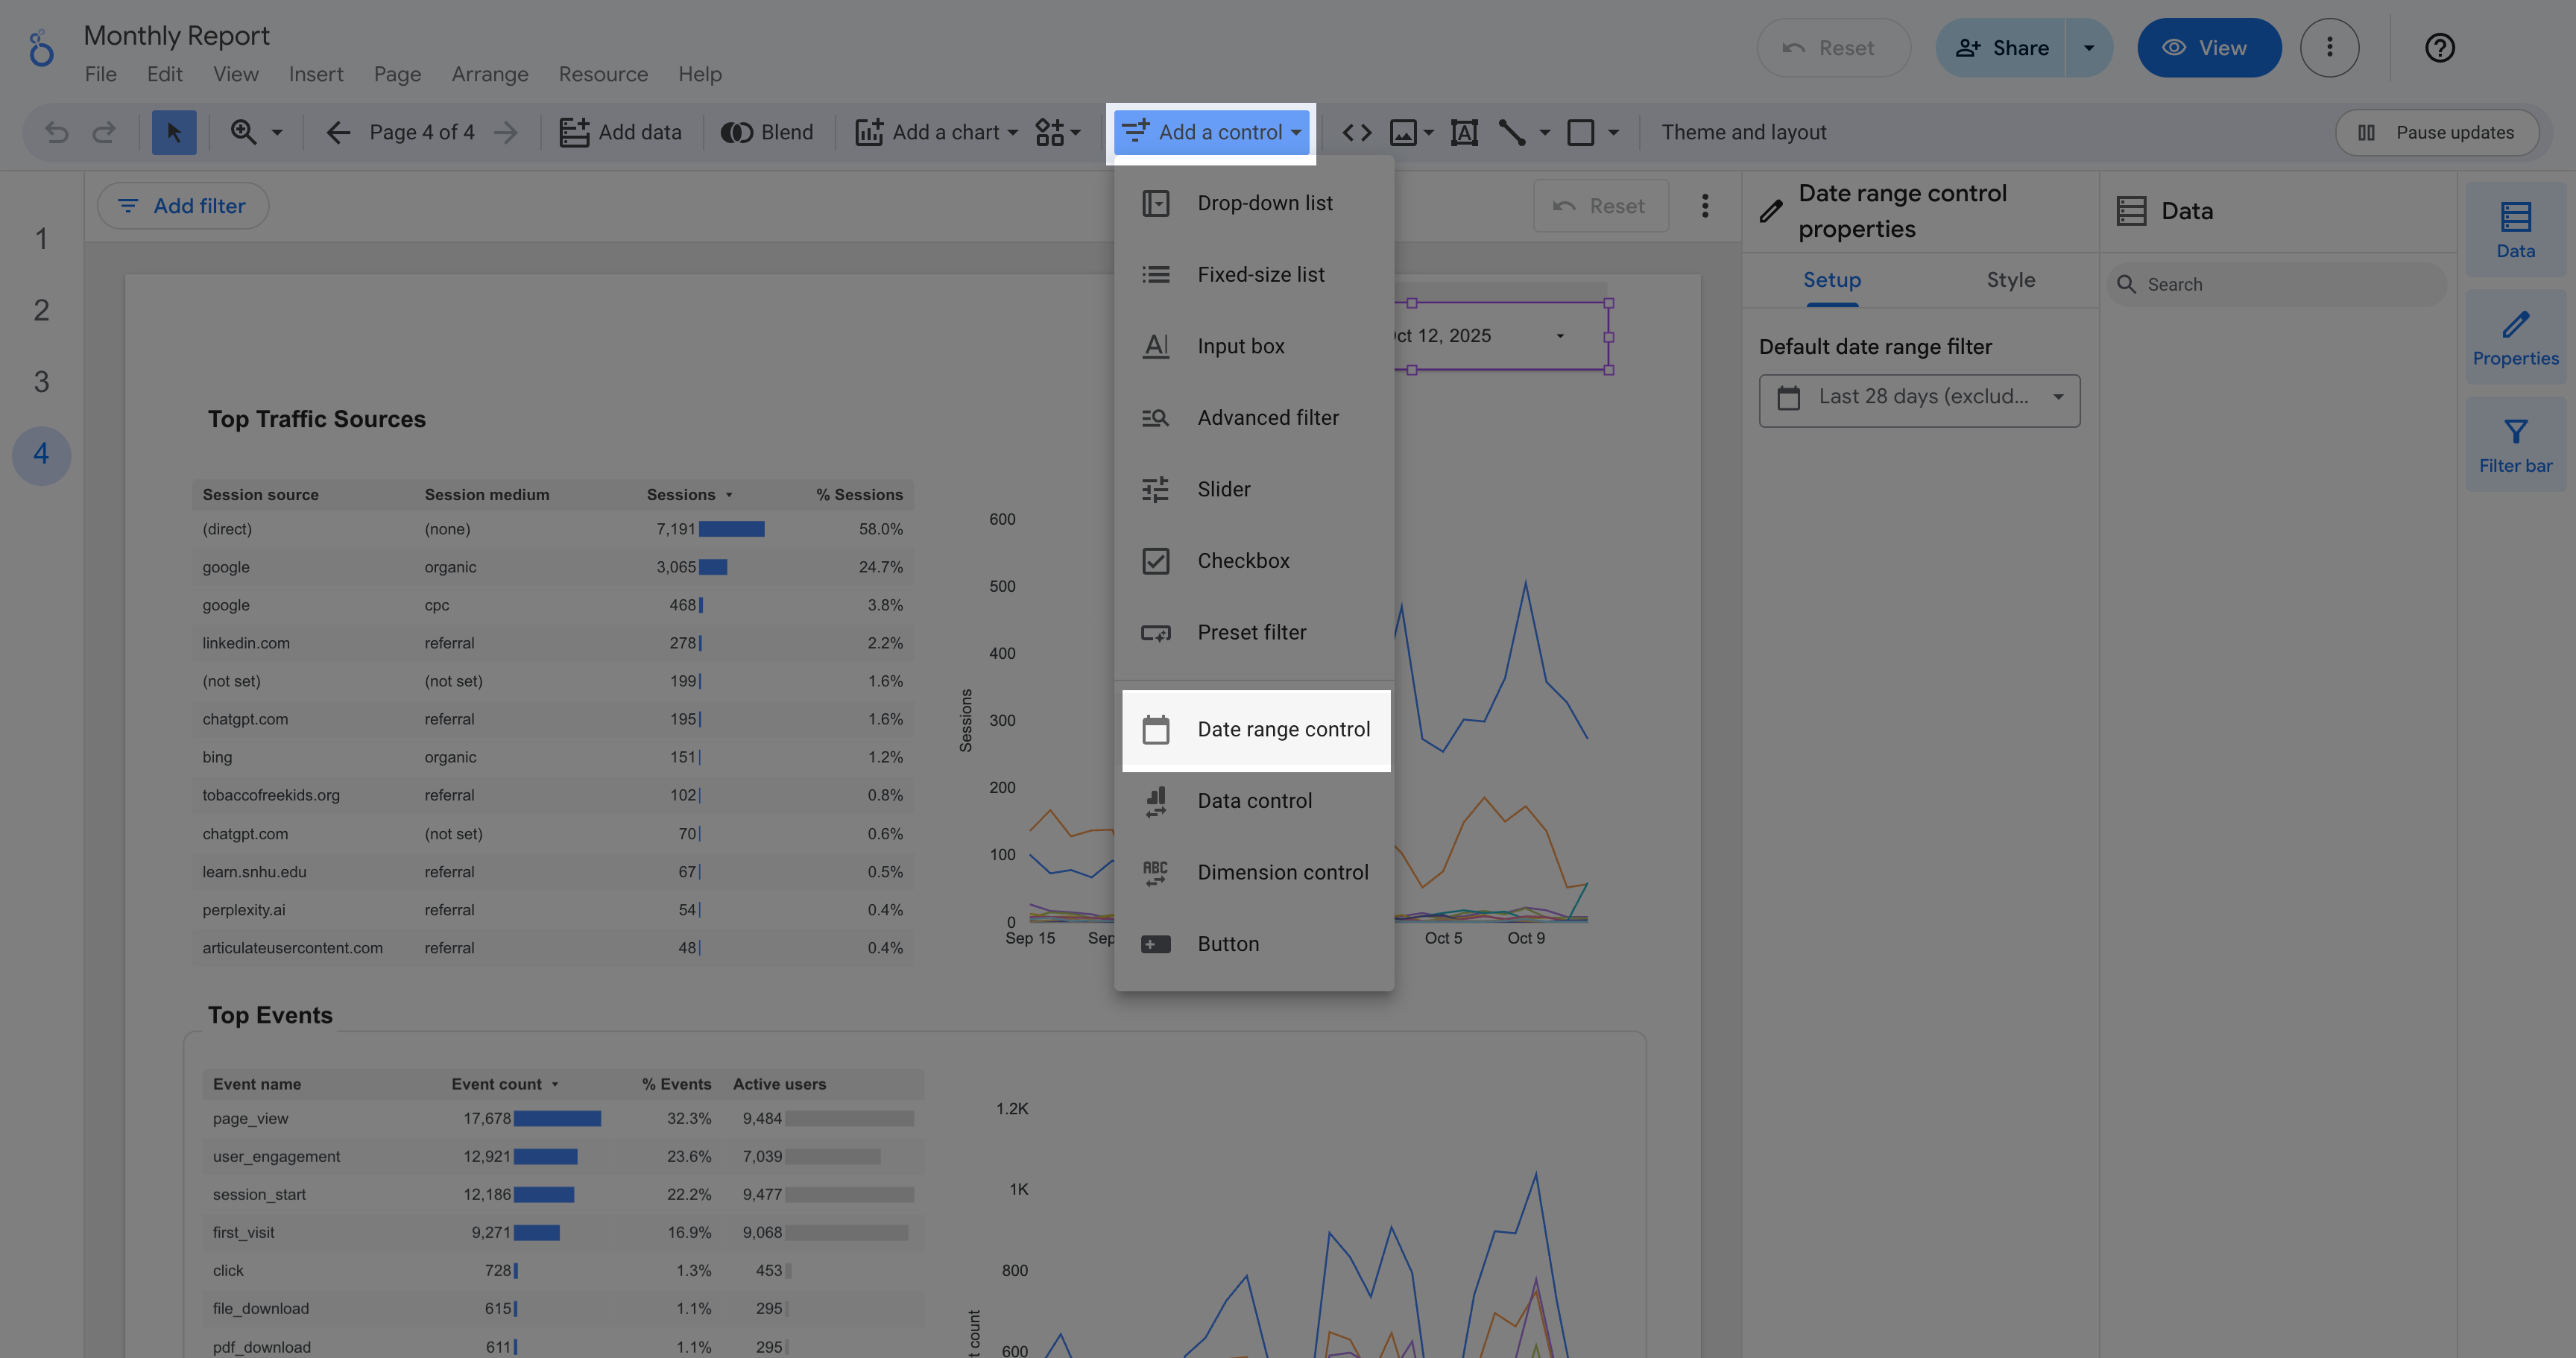
Make sure to Right click on the Date Range and then select Make page-level to filter data across all pages.
Capture Demographics Data #
Want to see your users’ age, gender, and interests? You’ll need to enable Google Signals, which powers GA4’s demographic and interest reporting.
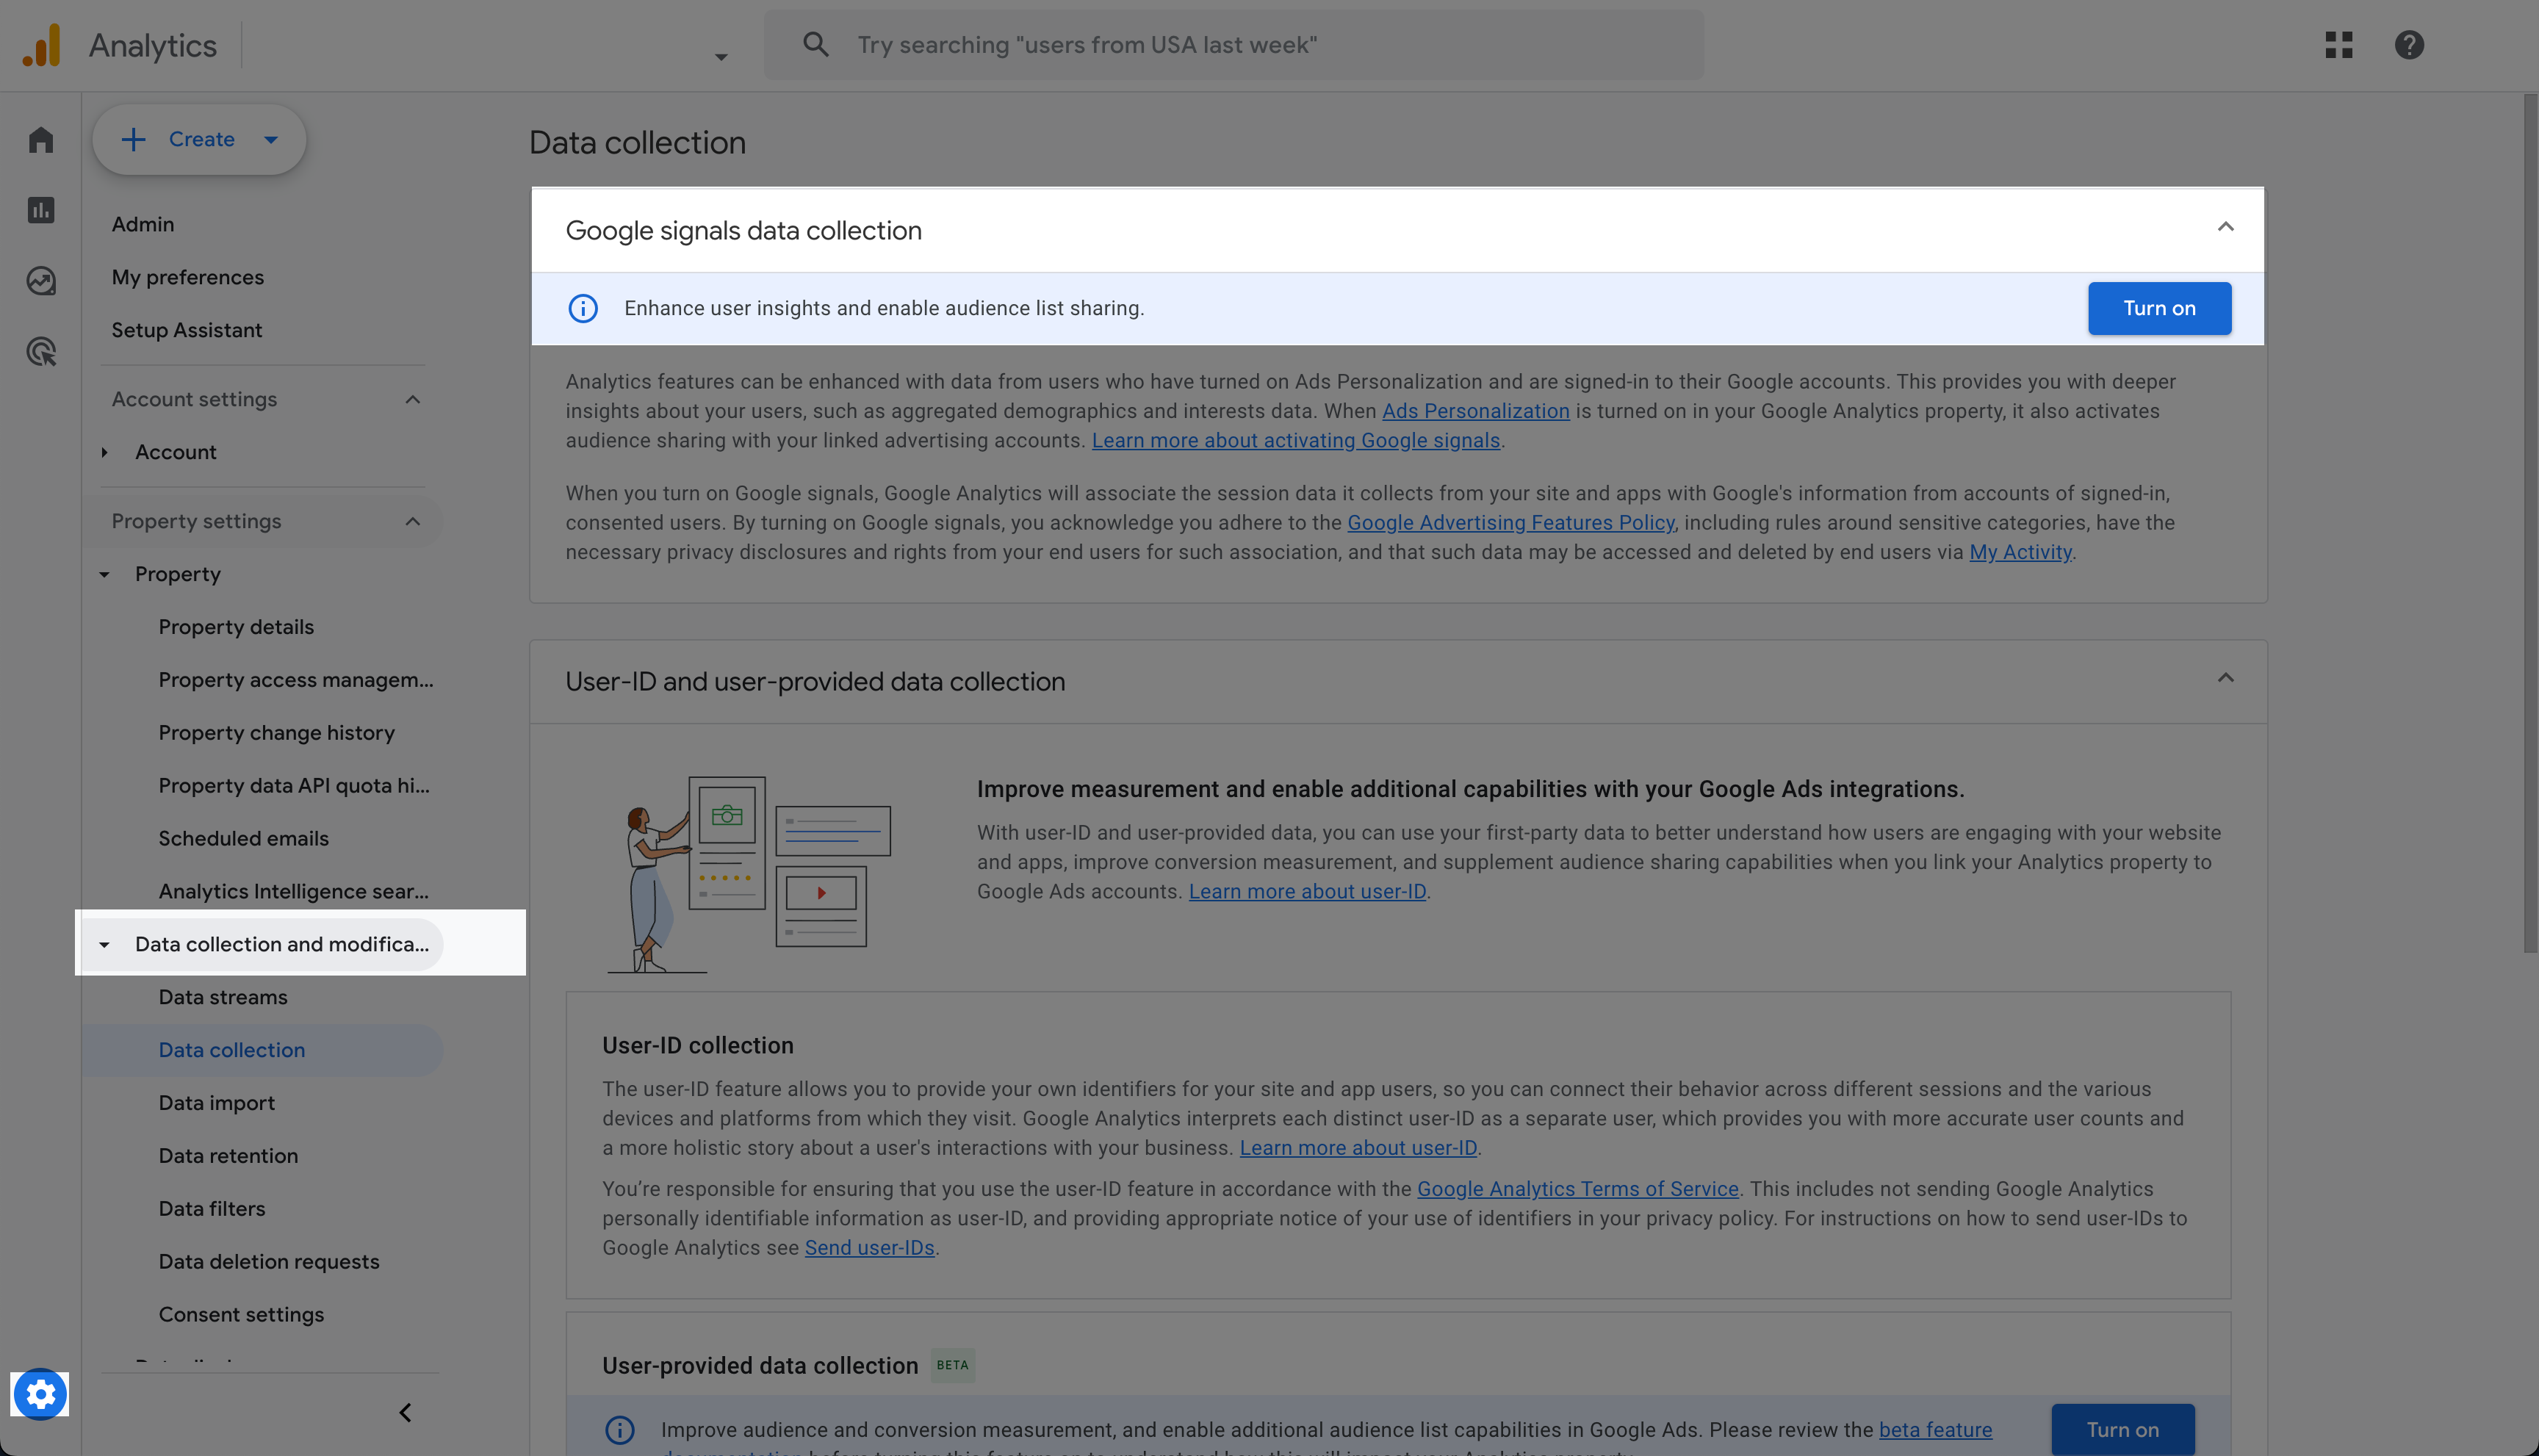
Turn on Google Signals #
- Go to Google Analytics
- In the bottom-left corner, click the ⚙️ Admin gear icon.
- Data Collection or Data Streams
- You’ll see a section called Google Signals data collection.
- Click Get started (if you haven’t already).
- Choose Activate → confirm.
Once activated, GA4 can start collecting demographic and interest info for users signed in to Google (in aggregate, privacy-safe form).
⚠️ Note: Demographic data only starts collecting after activation — it’s not retroactive.
Capture On-Site Search Keywords #
Want to see what visitors are searching for on your site? GA4 can automatically track on-site searches via Enhanced Measurement.
If your search results page looks like this:
/q?query=flavored+tobacco
- Go to Admin and locate Enhanced Measurement → Gear icon ⚙️.
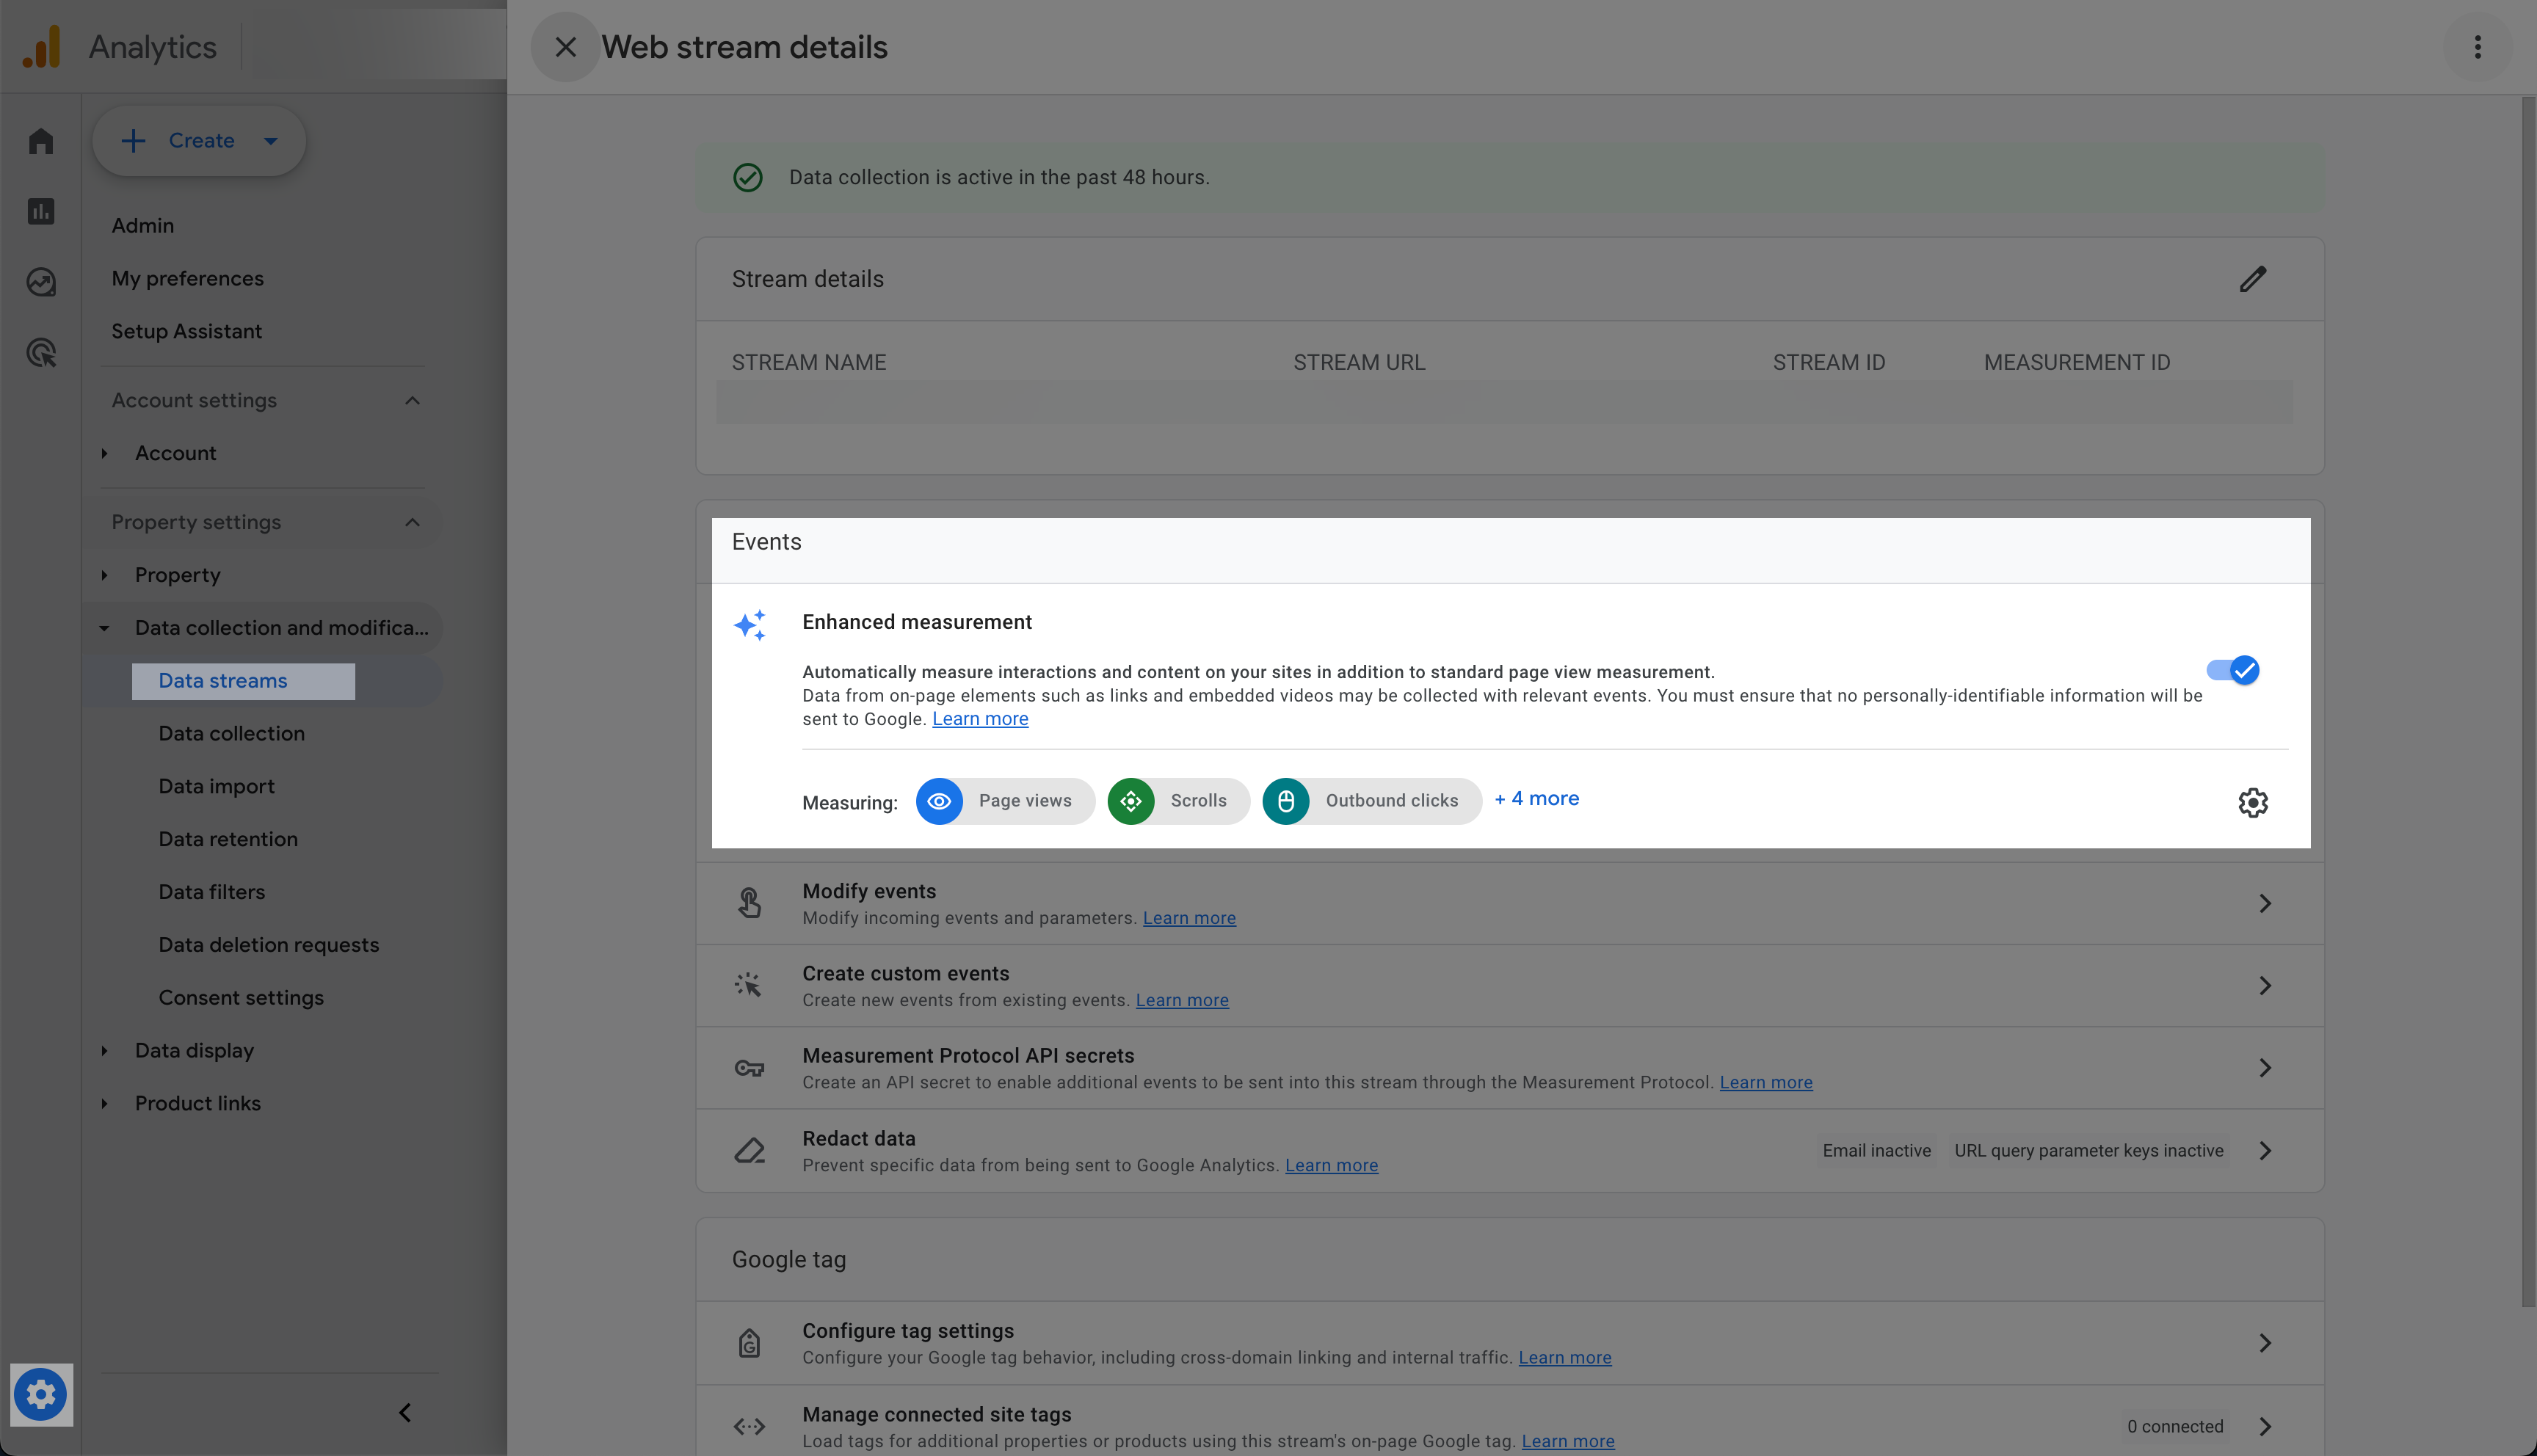
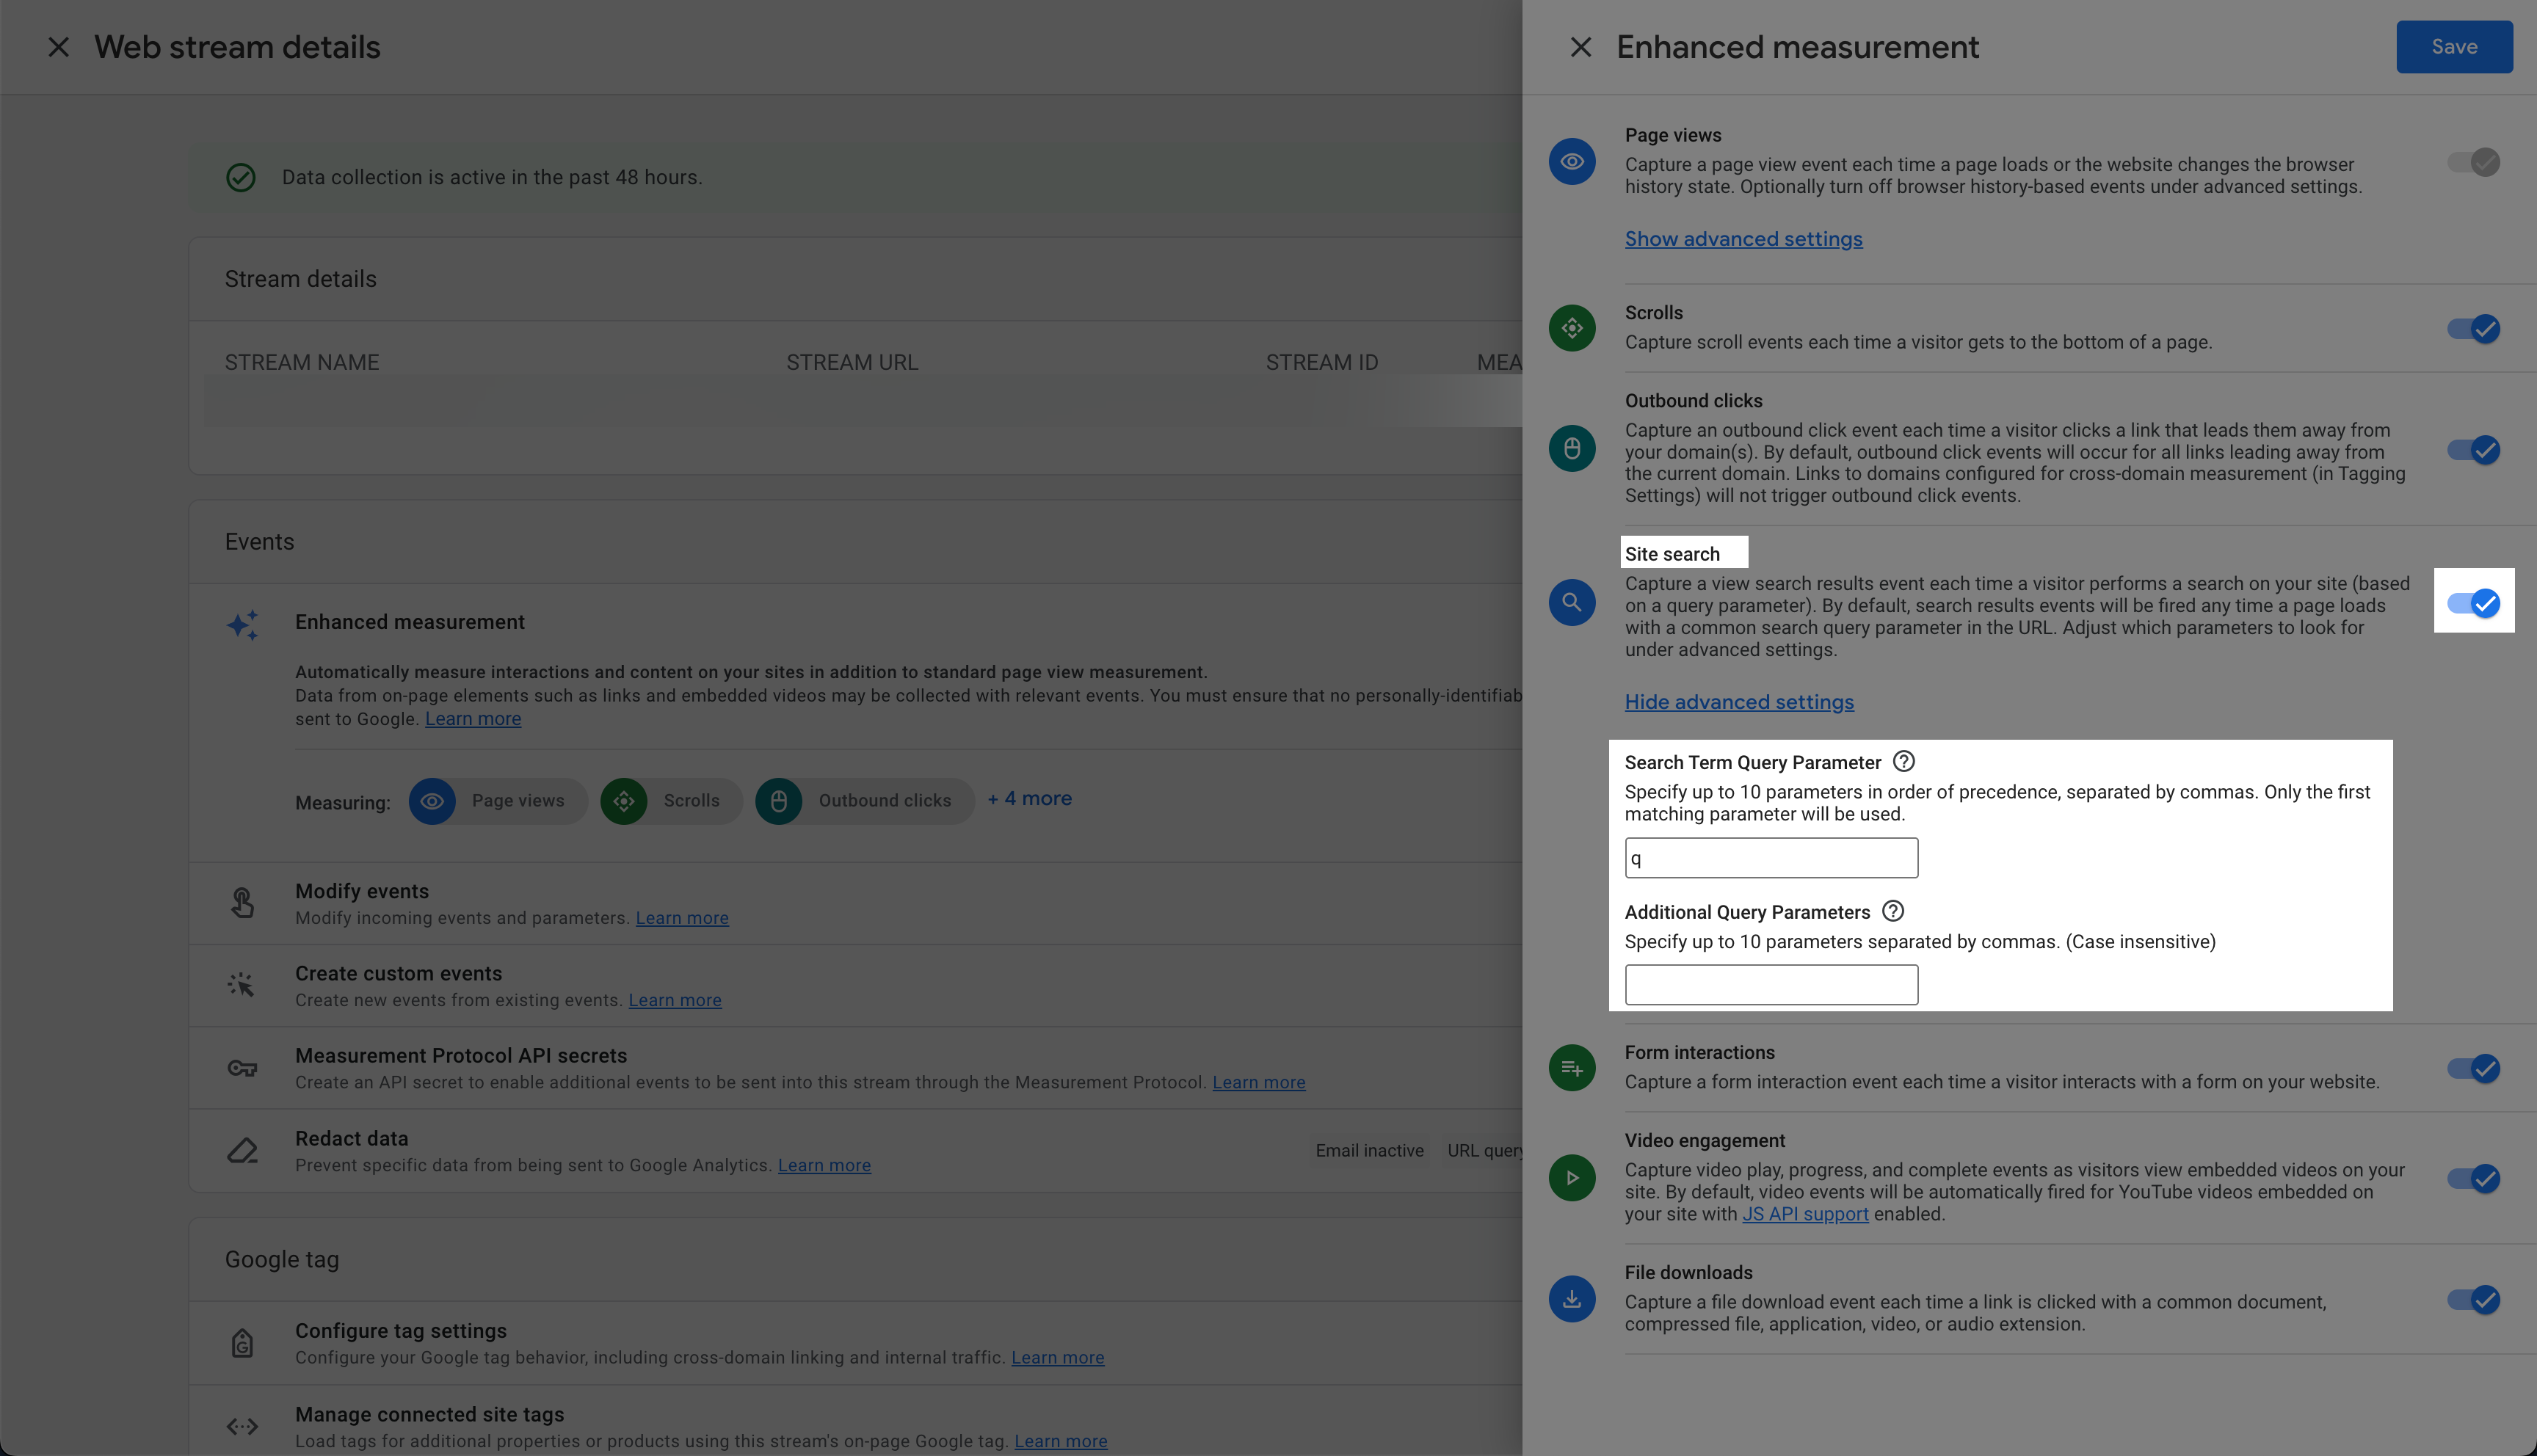
- Find Site Search.
- Make sure it’s toggled ON.
- Under Query parameter, enter your search field’s query parameter (e.g., query, search, or q).
✅ Visualize On-Site Searches in Looker Studio You can now visualize top searched terms directly in your Looker Studio dashboard — helping you discover what users want most.
- Metric:
event_name = view_search_results - Dimension:
q
Ready to Simplify Your Analytics? #
🚀 At EaglePeak Consulting, we help businesses transform raw data into easy-to-understand dashboards that drive real decisions.
If you’d like help setting up or automating your GA4 reports, contact us here
